Fig. 6
Download original image
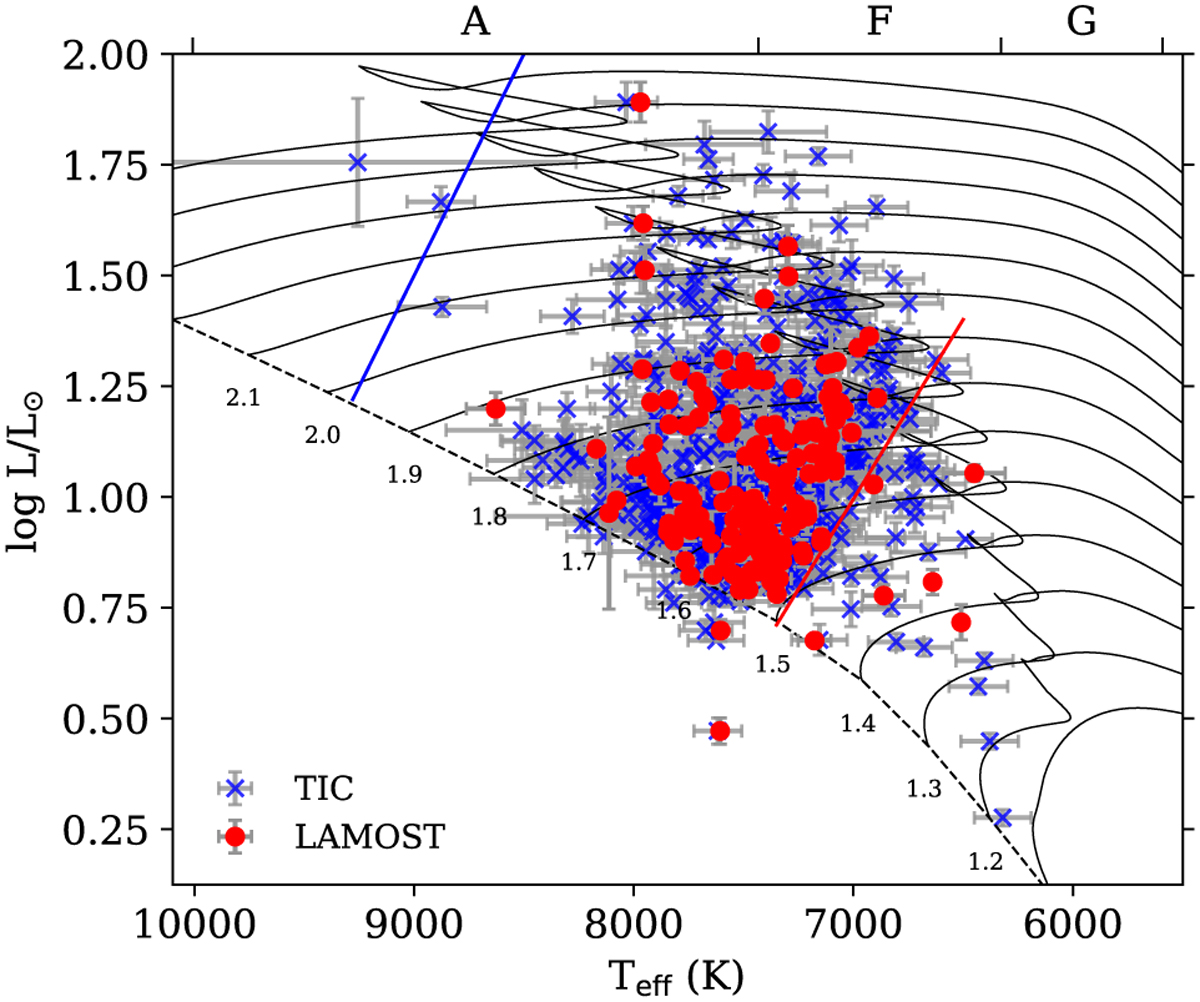
HR diagram of δ Scuti stars. The blue dots represent the location of the δ Scuti stars using the TIC parameters, while the red dots represent the subgroup of stars with spectroscopic values of Teff from LAMOST. The observational instability strip boundaries from Murphy et al. (2019) are shown as solid lines. The evolutionary tracks were computed using MESA v10108 with X = 0.71 and Z = 0.01.
Current usage metrics show cumulative count of Article Views (full-text article views including HTML views, PDF and ePub downloads, according to the available data) and Abstracts Views on Vision4Press platform.
Data correspond to usage on the plateform after 2015. The current usage metrics is available 48-96 hours after online publication and is updated daily on week days.
Initial download of the metrics may take a while.