Fig. 3
Download original image
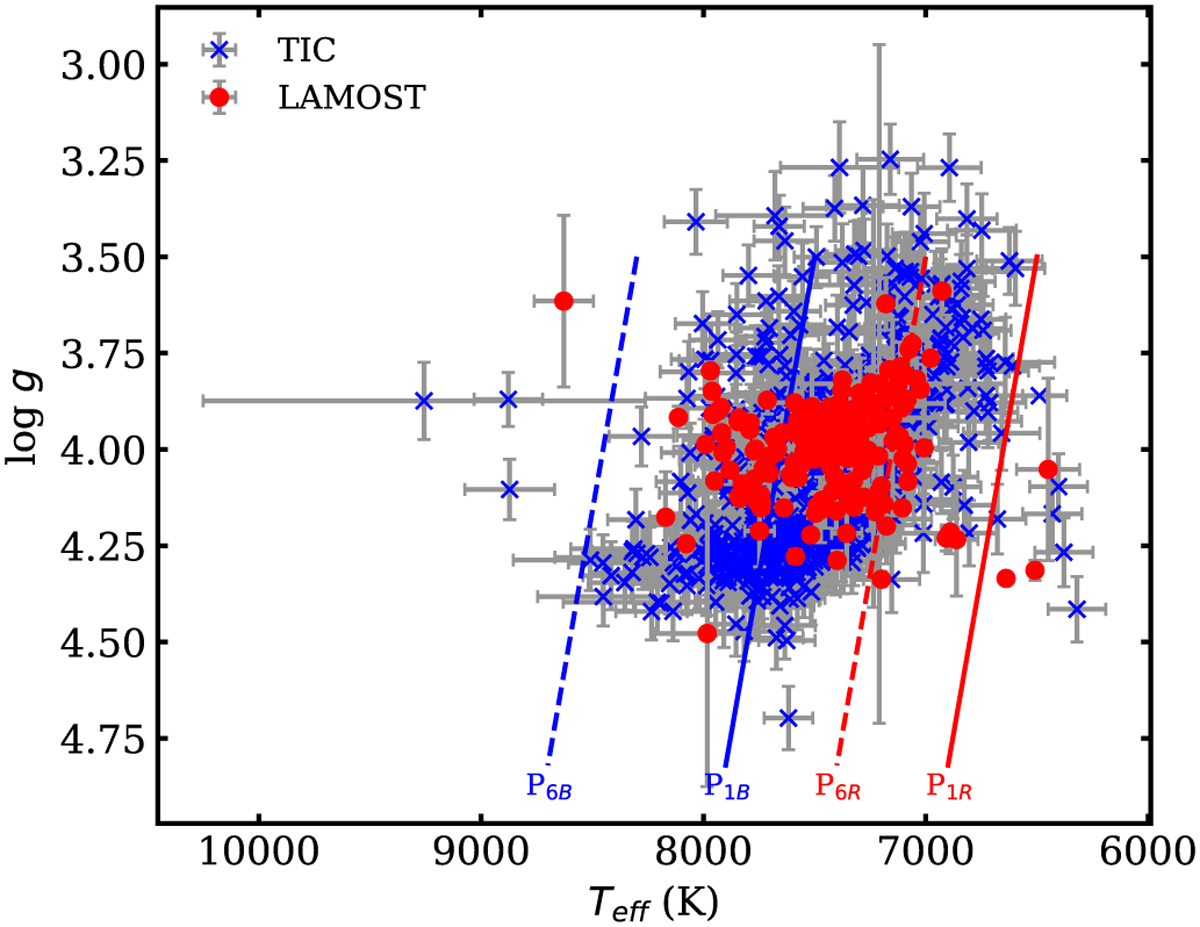
Teff – log g diagram for our 765 δ Scuti stars observed by TESS. The blue dots represent the positions of δ Scuti stars using parameters from the TIC, while the red dots correspond to a subgroup of δ Scuti stars with spectroscopic Teff and log g values. The solid blue and red lines indicate the theoretical blue and red edges of the classical instability strip, respectively, for p modes with radial order n = 1, while the dashed blue and red lines represent radial order n = 6 according to Dupret et al. (2005).
Current usage metrics show cumulative count of Article Views (full-text article views including HTML views, PDF and ePub downloads, according to the available data) and Abstracts Views on Vision4Press platform.
Data correspond to usage on the plateform after 2015. The current usage metrics is available 48-96 hours after online publication and is updated daily on week days.
Initial download of the metrics may take a while.