Open Access
Fig. 10
Download original image
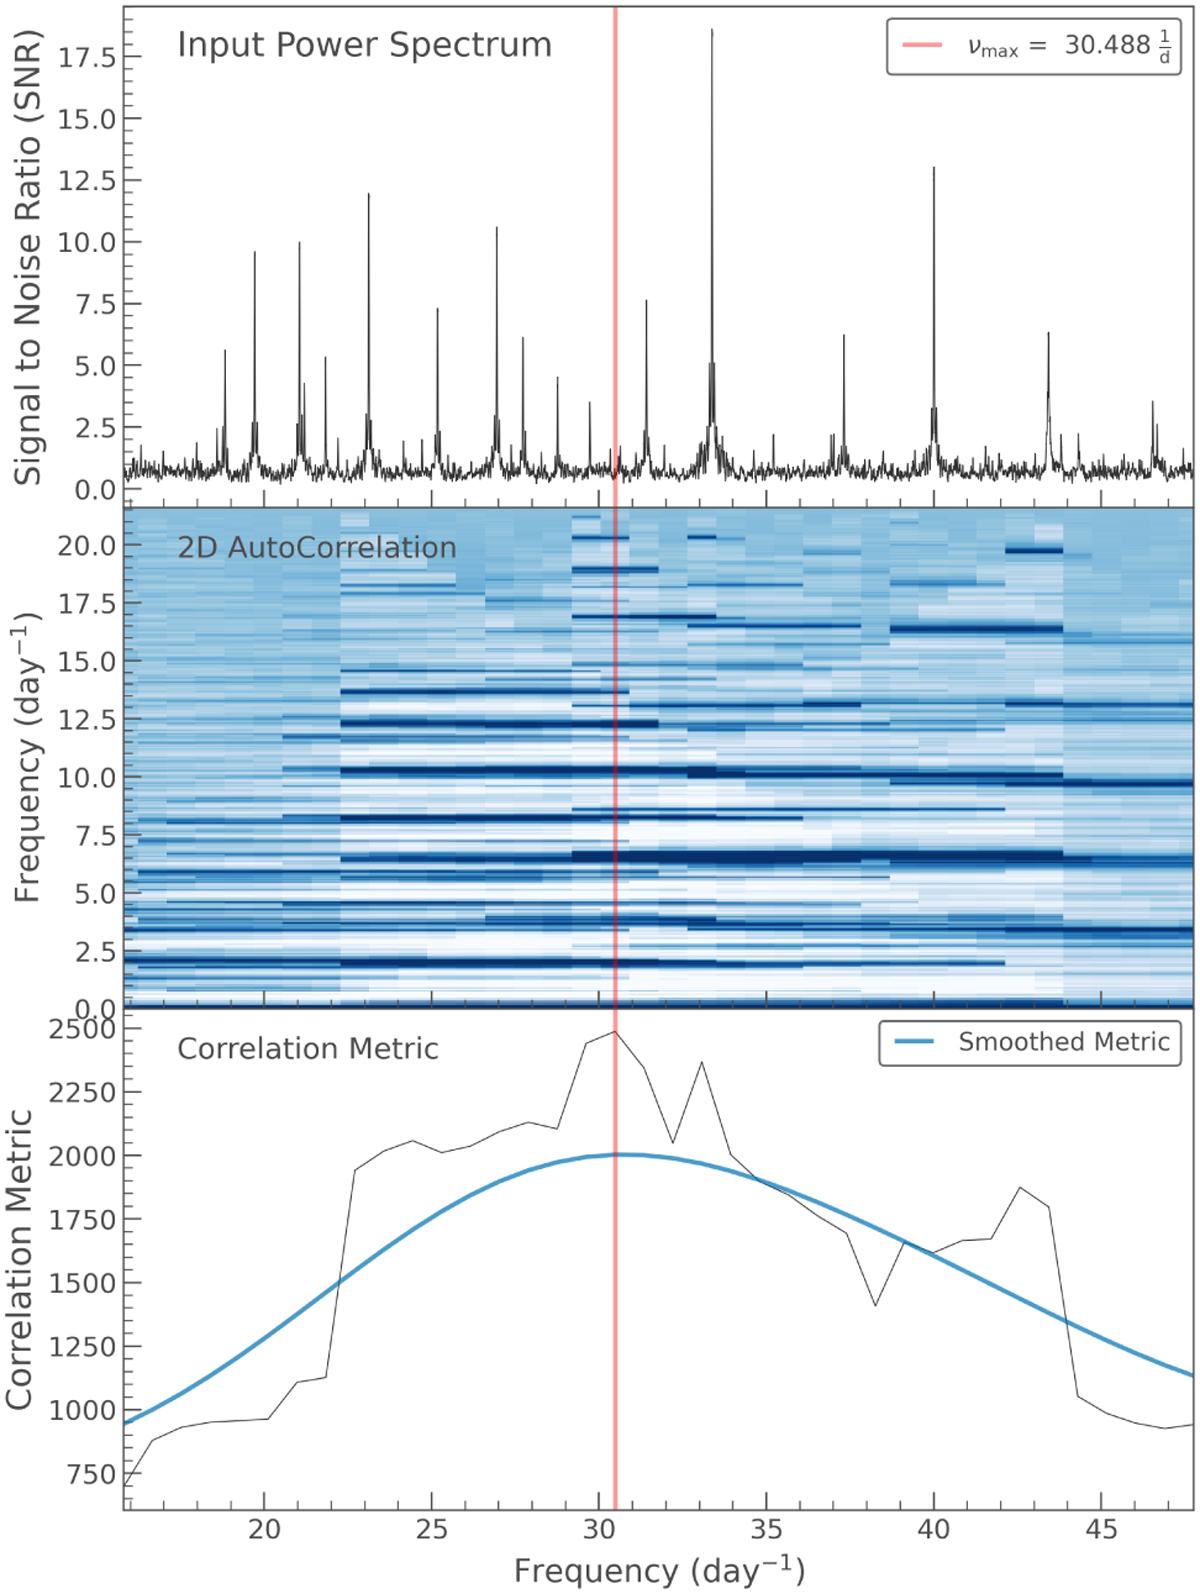
S/N frequency spectra for TIC 17489989 is in the upper panel. The vmax is indicated by the red line. Frequency spectra with 2D autocorrelation applied are in the middle panel. Lower panel: Gaussian-smoothed curve (blue line) and the mean collapsed correlation shown against the frequency (see Viani et al. 2019).
Current usage metrics show cumulative count of Article Views (full-text article views including HTML views, PDF and ePub downloads, according to the available data) and Abstracts Views on Vision4Press platform.
Data correspond to usage on the plateform after 2015. The current usage metrics is available 48-96 hours after online publication and is updated daily on week days.
Initial download of the metrics may take a while.