Fig. 5.
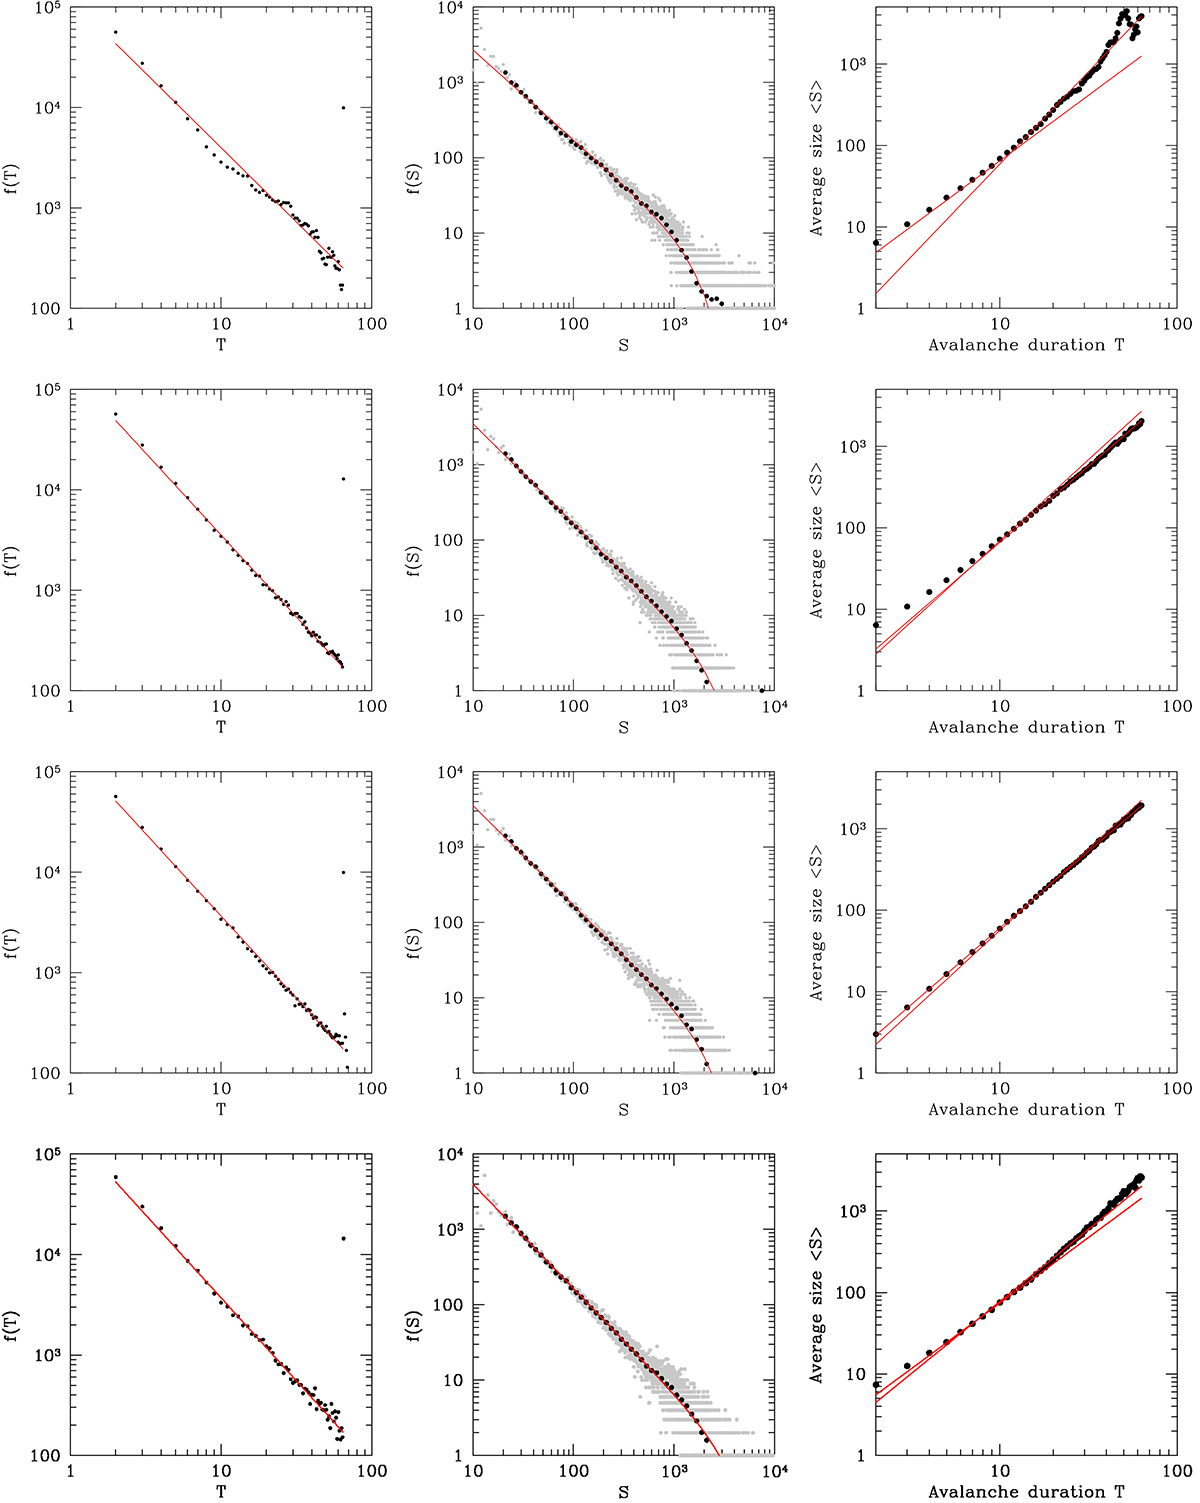
Download original image
Left panels: distribution of the avalanche duration f(T). Central panels: distribution of the avalanche size f(S). The gray points are the original distribution function, and the black points mark the distribution logarithmically binned. Right panels: average avalanche size ⟨S⟩ vs. avalanche duration T. Upper panels: setup 1, similar to the original simulation of Mineshige et al. (1994a,b). Central upper panels: setup 2, including a link between mass accretion and wind mass outflow as in MCDW models. Central lower panels: setup 3, including a link between mass accretion and wind mass outflow as in MCDW models and an Eddington-like limit on the mass-accretion rate due to the wind thrust that contrasts the accretion flow at the first radius. Bottom panels: setup 4. This is the same as setup 1, but includes a threshold on the disk luminosity above which the accretion is halted (similar to an Eddington limit). The red lines in the left and central panels are best-fit models. The red lines in the right panels bridge the interval of allowed α.
Current usage metrics show cumulative count of Article Views (full-text article views including HTML views, PDF and ePub downloads, according to the available data) and Abstracts Views on Vision4Press platform.
Data correspond to usage on the plateform after 2015. The current usage metrics is available 48-96 hours after online publication and is updated daily on week days.
Initial download of the metrics may take a while.