Open Access
Fig. D.1
Download original image
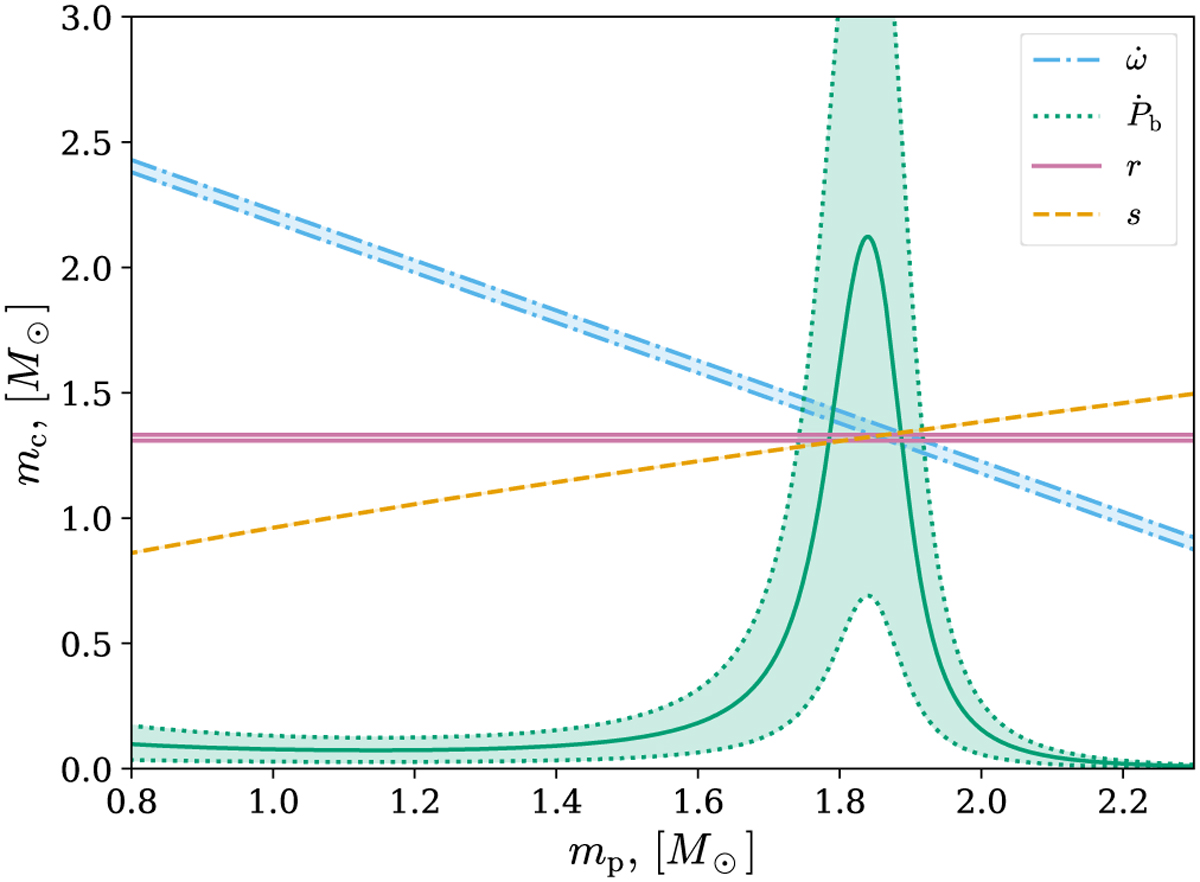
Mass-mass diagram in DEF gravity corresponding to a point near the ‘horn’ with α0 = −10−1, β0 = −1.9. The performed test is the same as for Fig. 1. The shadowed area is the allowed region at 68% CL limit for a corresponding PK parameter. The solid green line corresponds to the observed value of ![]() .
.
Current usage metrics show cumulative count of Article Views (full-text article views including HTML views, PDF and ePub downloads, according to the available data) and Abstracts Views on Vision4Press platform.
Data correspond to usage on the plateform after 2015. The current usage metrics is available 48-96 hours after online publication and is updated daily on week days.
Initial download of the metrics may take a while.