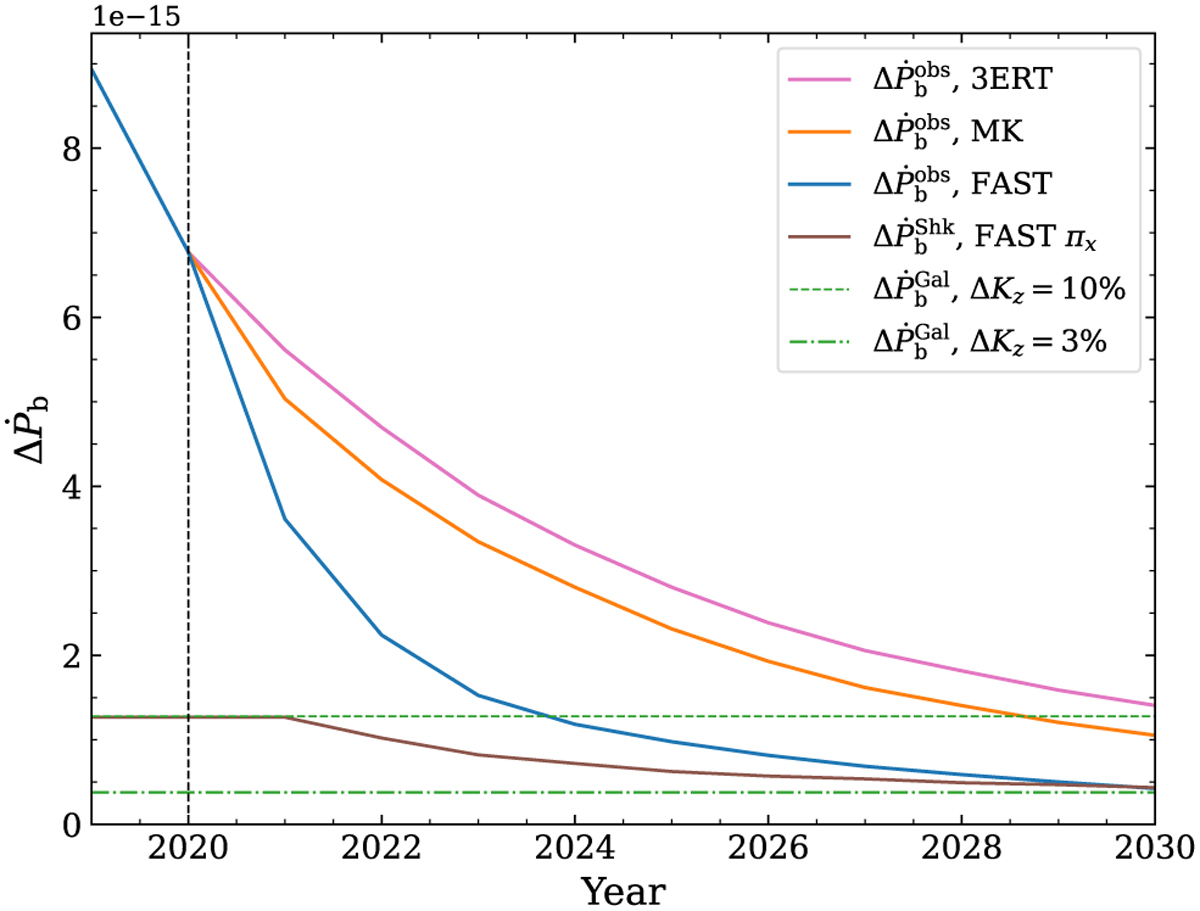
Fig. 5
Download original image
Comparison of different contributions in the uncertainty of Ṗb for simulated data from 2021 to 2030. The pink, orange and blue lines show the uncertainty of Ṗb using the simulated data from 3ERT (EFF, NC, LT), MeerKAT (MK), and FAST, respectively. The brown line indicates the uncertainty of ![]() when using the timing parallax (πx) measured from simulated FAST data. The green lines indicate the uncertainties of
when using the timing parallax (πx) measured from simulated FAST data. The green lines indicate the uncertainties of ![]() when assuming 10% (dashed) and 3% (dash-dotted) uncertainties in the vertical component of Galactic acceleration Kɀ.
when assuming 10% (dashed) and 3% (dash-dotted) uncertainties in the vertical component of Galactic acceleration Kɀ.
Current usage metrics show cumulative count of Article Views (full-text article views including HTML views, PDF and ePub downloads, according to the available data) and Abstracts Views on Vision4Press platform.
Data correspond to usage on the plateform after 2015. The current usage metrics is available 48-96 hours after online publication and is updated daily on week days.
Initial download of the metrics may take a while.