Fig. 4
Download original image
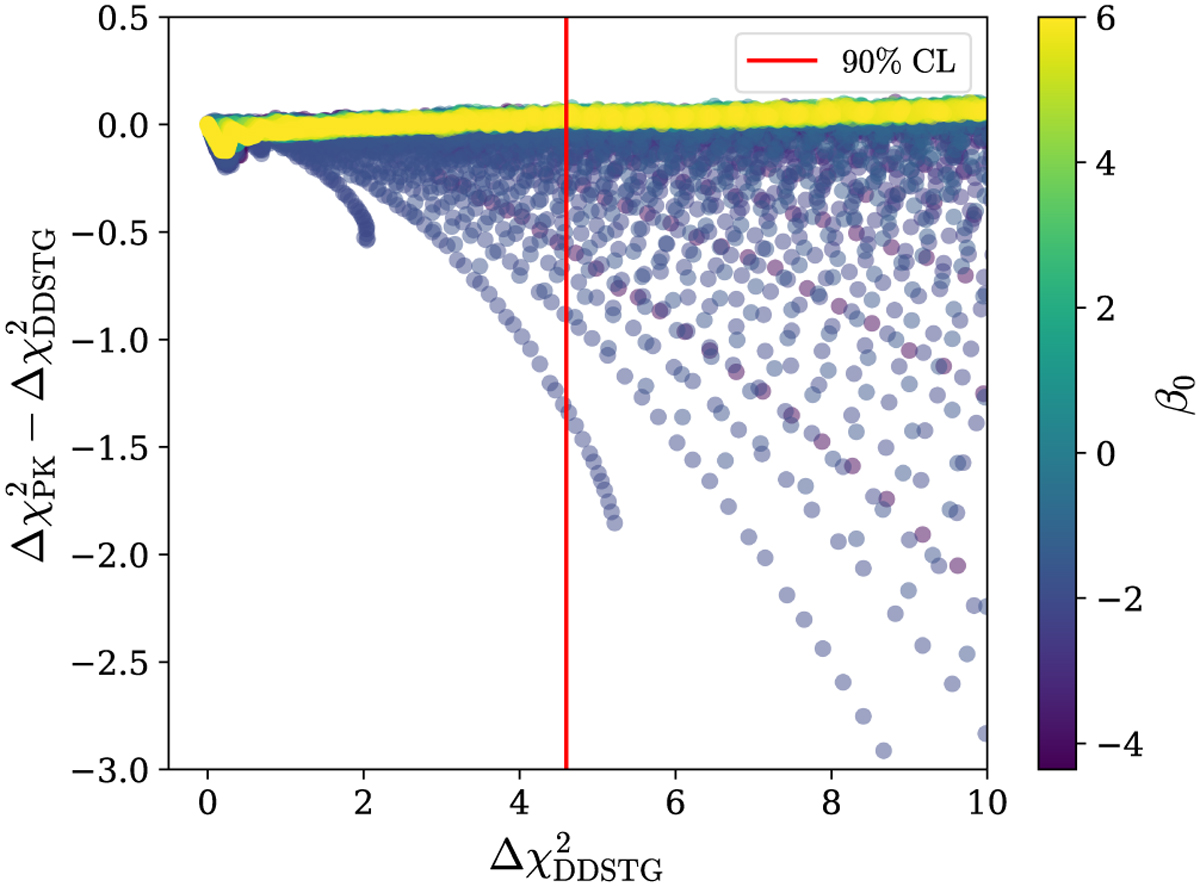
Comparison in the constraining power between the DDSTG model and the method based on measured PK parameters with the DD model. Both methods calculate χ2 values for a grid in {α0, β0} space, each point corresponds to a unique theory. β0 values are presented by the colour, while α0 values cover the [−10−1, −10−4] range. Red vertical line corresponds to the 90% CL limit, all points to the left are allowed by the test.
Current usage metrics show cumulative count of Article Views (full-text article views including HTML views, PDF and ePub downloads, according to the available data) and Abstracts Views on Vision4Press platform.
Data correspond to usage on the plateform after 2015. The current usage metrics is available 48-96 hours after online publication and is updated daily on week days.
Initial download of the metrics may take a while.