Fig. 9.
Download original image
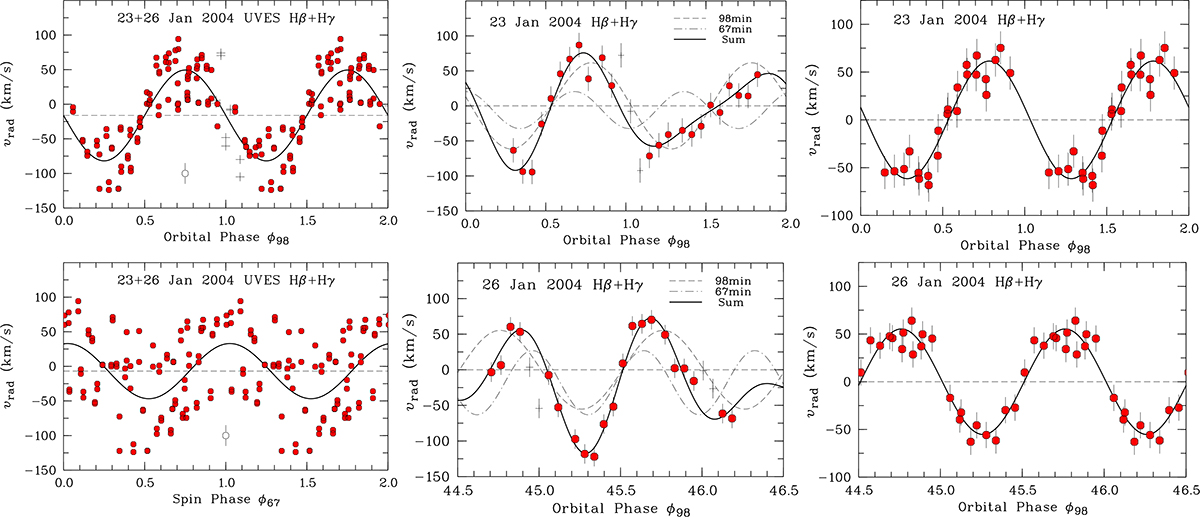
Radial velocities of Hβ and Hγ for the nights of 23 and 26 January 2004. Left panels: individual velocities of Hβ and Hγ for both nights plotted vs. orbital phase (top) and vs. spin phase (bottom). A typical error is shown attached to the open circle. The solid curves represent single sine fits. Center panels: mean radial velocities of Hβ and Hγ for 23 January (top) and 26 January (bottom), fitted by Eq. (7) (solid curve). The dashed and dash-dotted curves indicate the components that vary on the orbital and the spin periods, respectively. Right panels: same, but with the spin-modulated component subtracted.
Current usage metrics show cumulative count of Article Views (full-text article views including HTML views, PDF and ePub downloads, according to the available data) and Abstracts Views on Vision4Press platform.
Data correspond to usage on the plateform after 2015. The current usage metrics is available 48-96 hours after online publication and is updated daily on week days.
Initial download of the metrics may take a while.