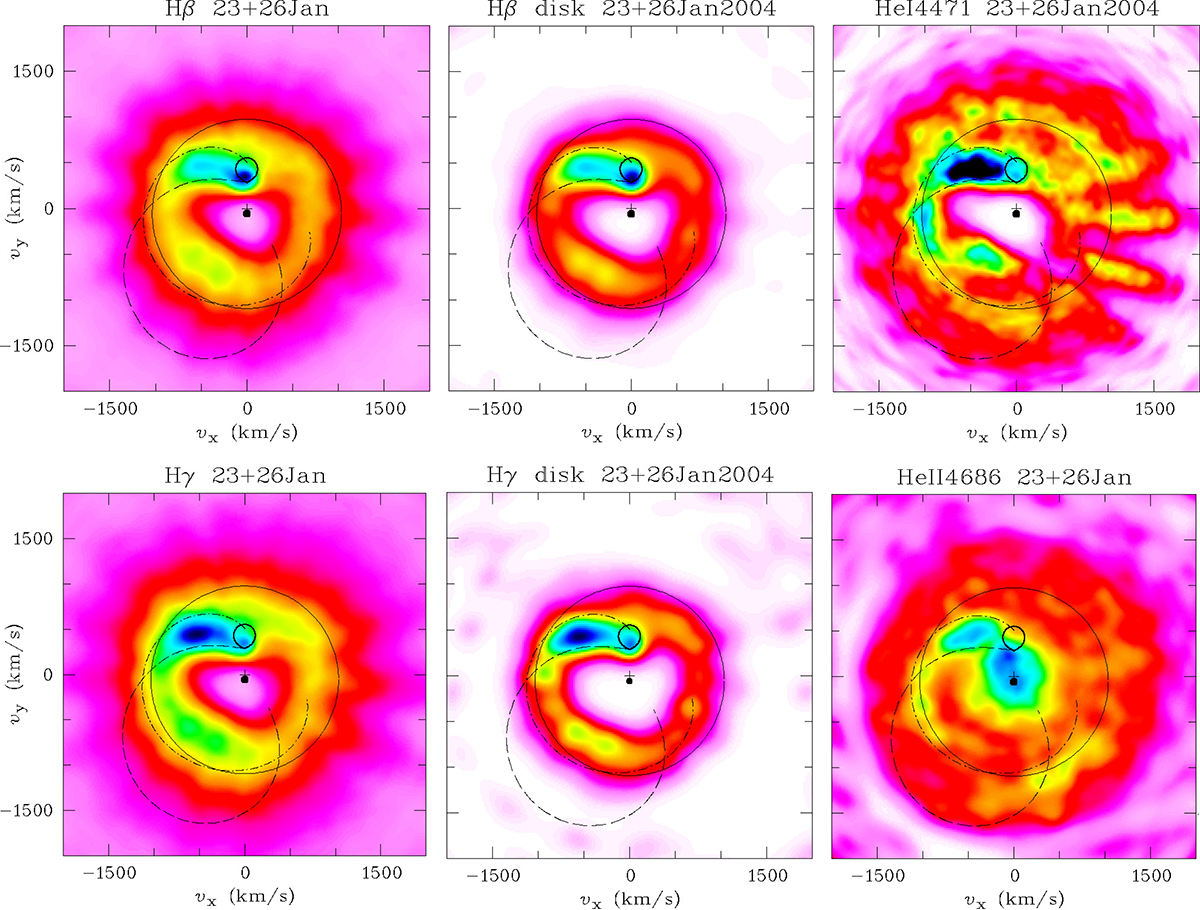
Fig. 8.
Download original image
Orbital tomograms of emission lines of EX Hya. Top, from left: (1) Tomogram of the observed Hβ spectra, (2) Tomogram of the disk component of Hβ after subtraction of the spin-modulated component, (3) Tomogram of the observed spectra of He Iλ4471. Bottom, from left: (4) Tomogram of the observed Hγ spectra, (5) Tomogram of the disk component of Hγ, (6) Tomogram of the observed spectra of He IIλ4686. In each panel the dashed curve indicates the single-particle trajectory and the dot-dashed curve the Kepler velocity along that path. The solid circle denotes the velocity at the circularization radius, shifted by −59 km s−1 in υy to be centered on the WD. The color scale is as follows: white = 0.0, magenta ≃ 0.10, red ≃ 0.25, yellow ≃ 0.40, green ≃ 0.55, cyan ≃ 0.70, light blue ≃ 0.80, dark blue ≃ 0.90, black = 1.0.
Current usage metrics show cumulative count of Article Views (full-text article views including HTML views, PDF and ePub downloads, according to the available data) and Abstracts Views on Vision4Press platform.
Data correspond to usage on the plateform after 2015. The current usage metrics is available 48-96 hours after online publication and is updated daily on week days.
Initial download of the metrics may take a while.