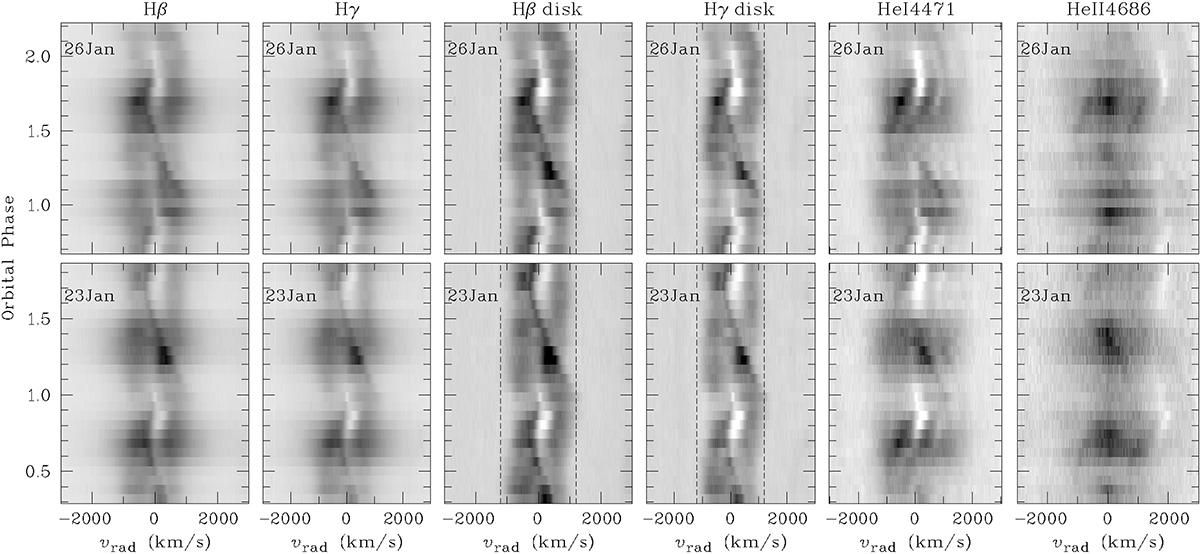
Fig. 7.
Download original image
Trailed hydrogen and helium emission line spectra. Left two panels: observed line profiles of Hβ and Hγ. Center two panels: disk component obtained by subtracting the fitted spin component from the observed profiles (see text). The emission of this component stays between the two vertical dashed lines at υterm = ±1200 km s−1. Right two panels: trailed line spectra of He Iλ4471 and HeII [[INLINE178]]. These are disturbed by Mg IIλ4481 and He I λ4713 centered at +650 km s−1 and +1750 km s−1, respectively.
Current usage metrics show cumulative count of Article Views (full-text article views including HTML views, PDF and ePub downloads, according to the available data) and Abstracts Views on Vision4Press platform.
Data correspond to usage on the plateform after 2015. The current usage metrics is available 48-96 hours after online publication and is updated daily on week days.
Initial download of the metrics may take a while.