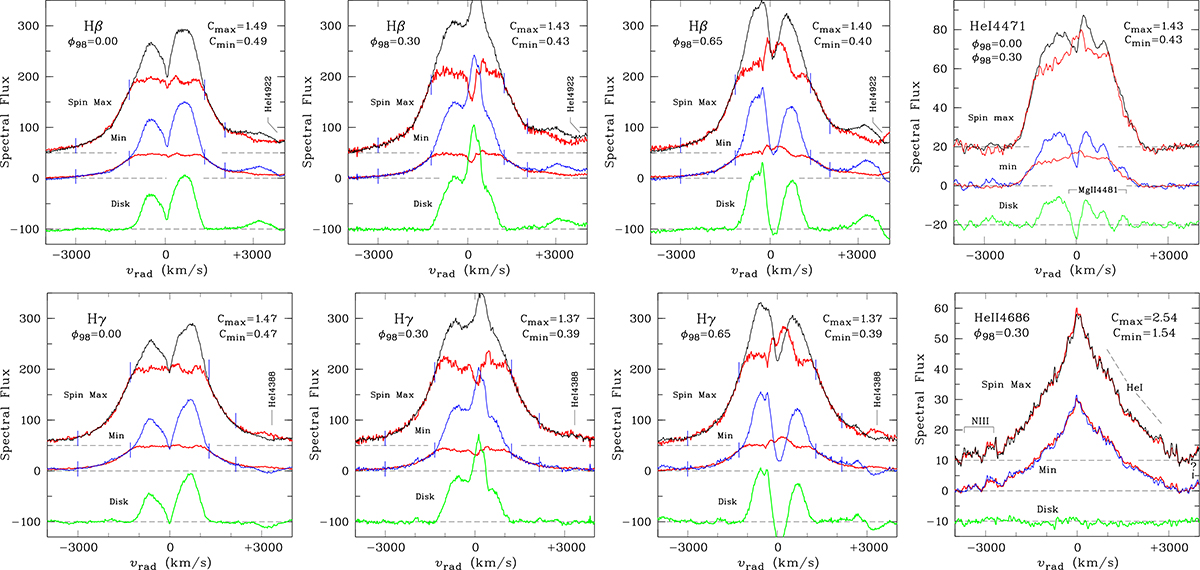
Fig. 5.
Download original image
Hβ and Hγ spin maximum and minimum spectra (black and blue, respectively) at ϕ98 = 0.30, 0.65, and 1.0 (six left-most panels). Overplotted are the fitted spin-modulated components fmod(λ) from Eq. (4) with amplitudes Cmax and Cmin (red). Below, the derived disk component is shown (green). The two right panels show the decomposition of the He Iλ4471 line at ϕ98 = 0.0 and 0.30 and of He IIλ4686 at ϕ98 = 0.30. No He II emission from the disk is seen, but S-wave emission is present at other orbital phases (see text).
Current usage metrics show cumulative count of Article Views (full-text article views including HTML views, PDF and ePub downloads, according to the available data) and Abstracts Views on Vision4Press platform.
Data correspond to usage on the plateform after 2015. The current usage metrics is available 48-96 hours after online publication and is updated daily on week days.
Initial download of the metrics may take a while.