Fig. 4.
Download original image
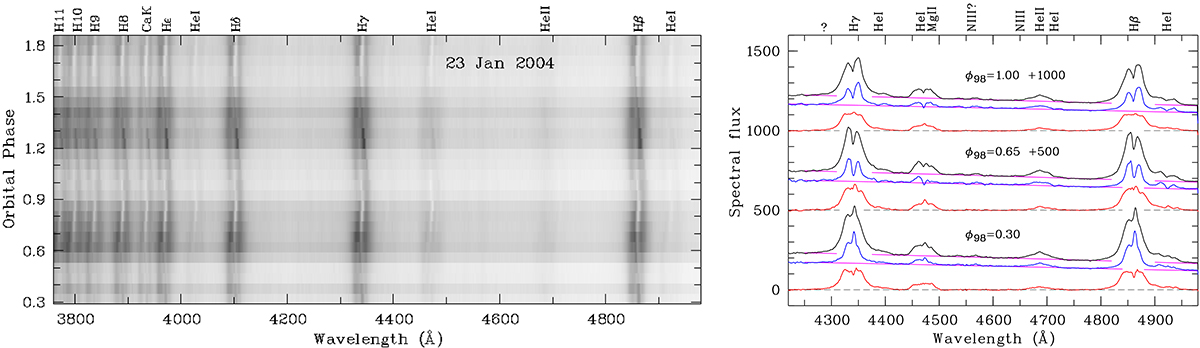
Flux-calibrated blue spectra taken on 23 and 26 January 2004. Left: grayscale representation of the first night, with spectral flux increasing from white to black. Right: mean spectra of the Hγ to Hβ spectral region at spin maximum (black) and spin minimum (blue) for the orbital phases noted in the figure. The best-fit continua that represent the lower envelope to the spectra are shown as magenta curves. The spin modulation of the emission-line component is shown in red.
Current usage metrics show cumulative count of Article Views (full-text article views including HTML views, PDF and ePub downloads, according to the available data) and Abstracts Views on Vision4Press platform.
Data correspond to usage on the plateform after 2015. The current usage metrics is available 48-96 hours after online publication and is updated daily on week days.
Initial download of the metrics may take a while.