Open Access
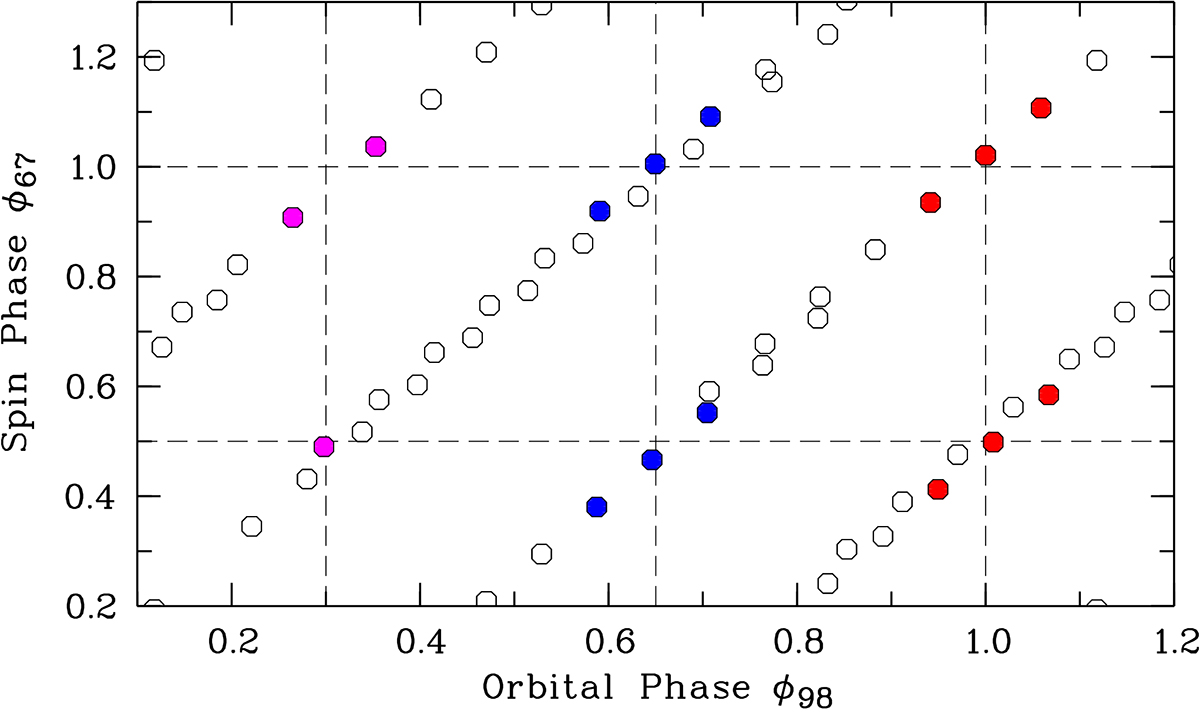
Fig. 3.
Download original image
Phase-space coverage of our 51 exposures in the ϕ67–ϕ98 plane. The spectra selected for the spectral decomposition at ϕ98 ≃ 0.30, 0.65, and 1.00 are marked by magenta, blue, and red dots respectively.
Current usage metrics show cumulative count of Article Views (full-text article views including HTML views, PDF and ePub downloads, according to the available data) and Abstracts Views on Vision4Press platform.
Data correspond to usage on the plateform after 2015. The current usage metrics is available 48-96 hours after online publication and is updated daily on week days.
Initial download of the metrics may take a while.