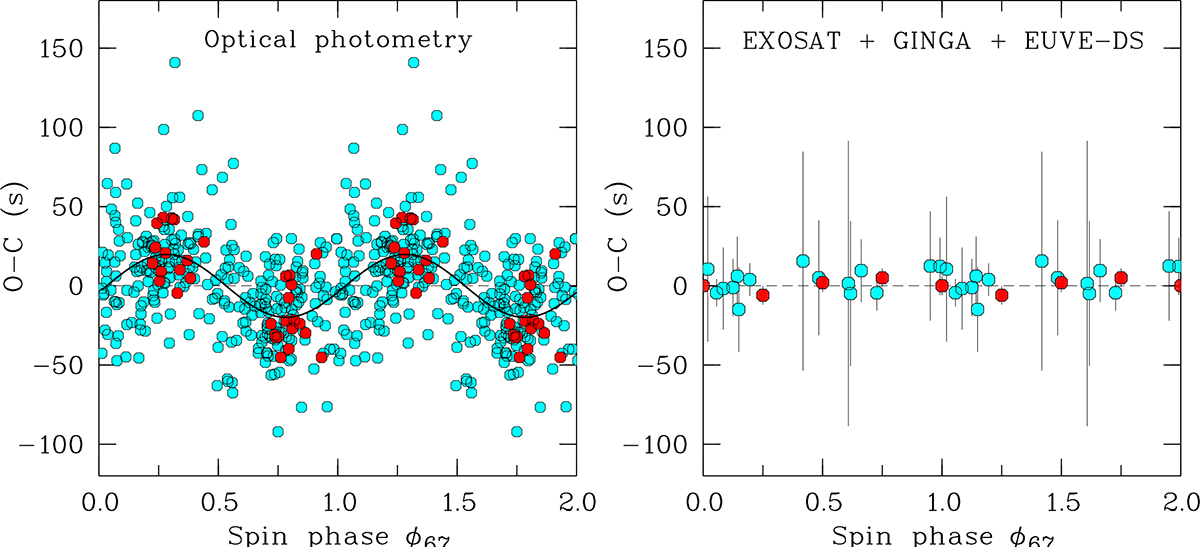
Fig. 10.
Download original image
O − C deviations of the mid-eclipse times vs. spin phase. Left: optical eclipse times collected by Echevarría et al. (2016, cyan) and by Siegel et al. (1989, red). The sinusoid fitted to all data has an amplitude of 20 s. Right: X-ray and EUV eclipse times observed with EXOSAT and GINGA (Rosen et al. 1988, 1991, cyan dots) and with the EUVE Deep Survey instrument (Hurwitz et al. 1997; Belle et al. 2002, red dots).
Current usage metrics show cumulative count of Article Views (full-text article views including HTML views, PDF and ePub downloads, according to the available data) and Abstracts Views on Vision4Press platform.
Data correspond to usage on the plateform after 2015. The current usage metrics is available 48-96 hours after online publication and is updated daily on week days.
Initial download of the metrics may take a while.