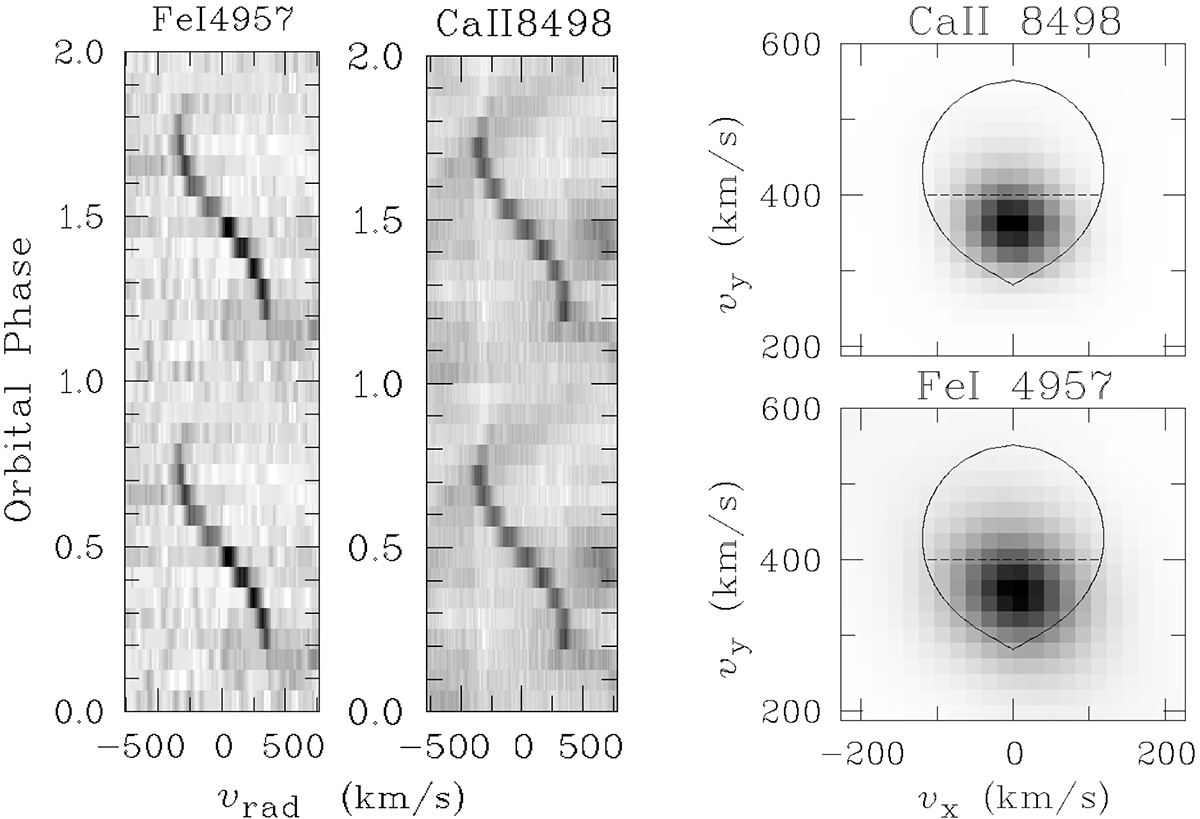
Fig. 1.
Download original image
VLT/UVES narrow emission line spectra of Fe Iλ4957 and Ca IIλ8498 observed on 23 and 26 January 2004. Left: grayscale representations of the trailed spectra. Spectral flux increases from white to black. For convenience, the data are shown twice. Right: corresponding tomograms with the Roche lobe contour of the secondary star based on the system parameters of Sect. 3.7 demonstrate the origin from the irradiated face of the secondary star. The relative intensity goes from white (0.0) to black (1.0). The origin of the coordinate system is at the center of gravity.
Current usage metrics show cumulative count of Article Views (full-text article views including HTML views, PDF and ePub downloads, according to the available data) and Abstracts Views on Vision4Press platform.
Data correspond to usage on the plateform after 2015. The current usage metrics is available 48-96 hours after online publication and is updated daily on week days.
Initial download of the metrics may take a while.