Open Access
Fig. B.1.
Download original image
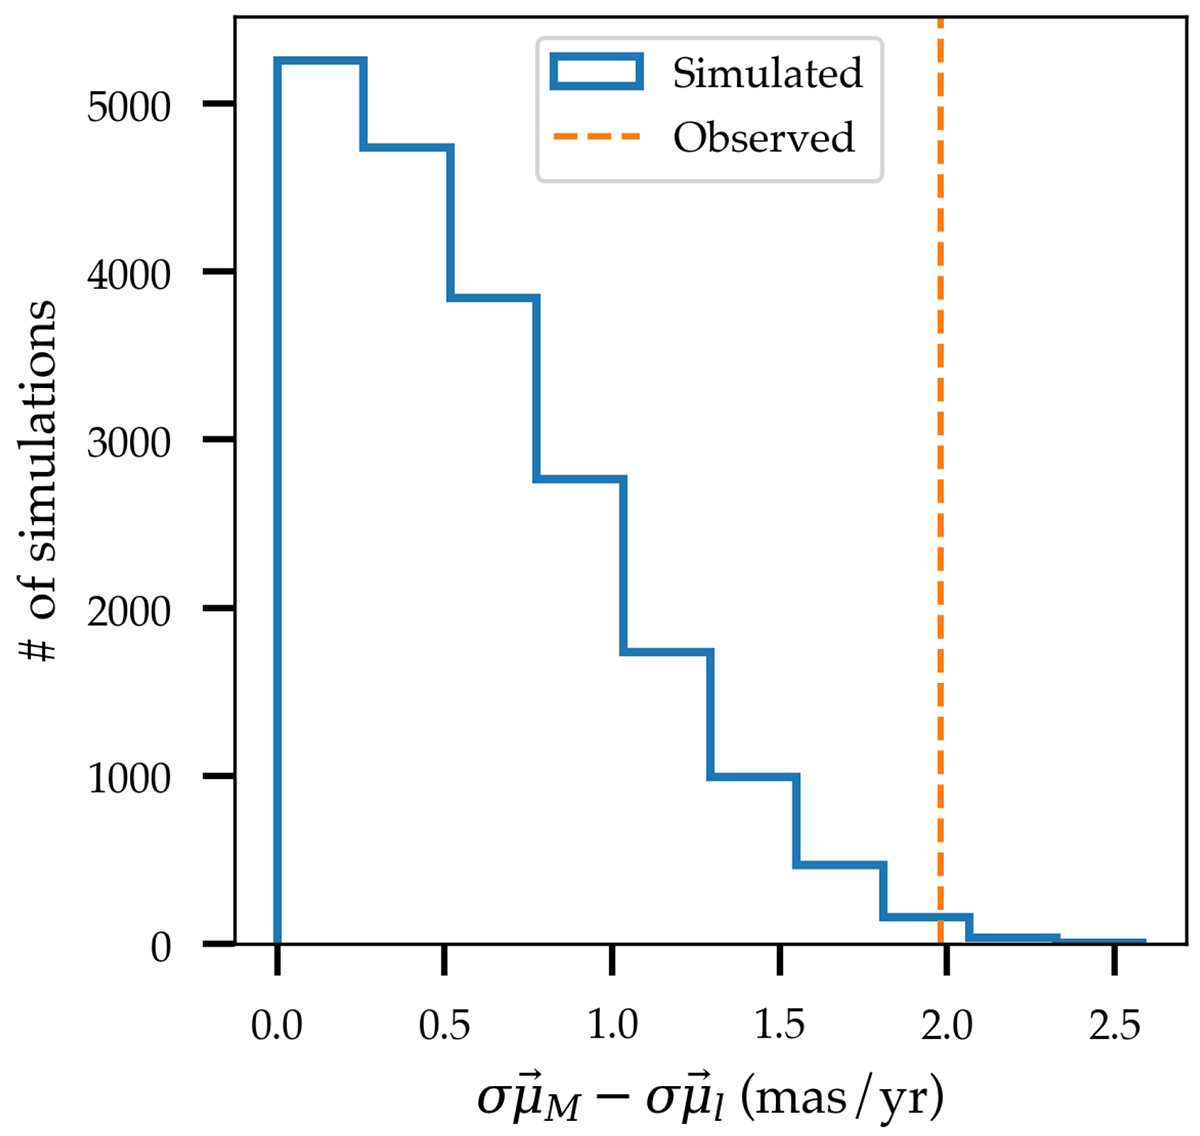
Velocity dispersion simulations. The blue histogram represent the difference in velocity dispersion between simulated populations of MYSs and late-type stars that where created by shuffling the velocities among the observed sample of stars. The dashed orange line represents the value between Can1 and the late-type stars.
Current usage metrics show cumulative count of Article Views (full-text article views including HTML views, PDF and ePub downloads, according to the available data) and Abstracts Views on Vision4Press platform.
Data correspond to usage on the plateform after 2015. The current usage metrics is available 48-96 hours after online publication and is updated daily on week days.
Initial download of the metrics may take a while.