Open Access
Fig. A.1.
Download original image
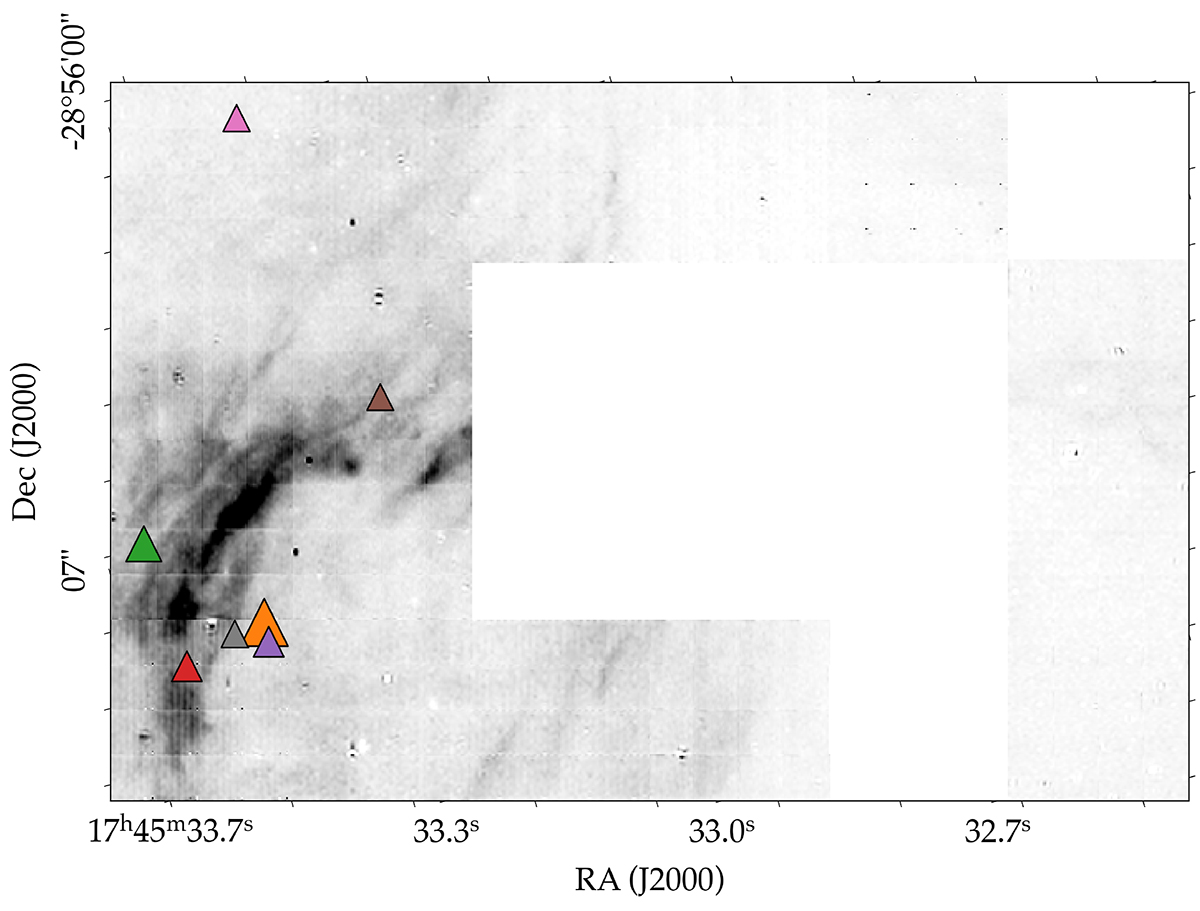
Brγ map obtained after continuum subtraction of the same area of Fig. 1. The colored triangles depict identified MYSs with a K magnitude brighter than 14.5. The size of each point is proportional to its magnitude.
Current usage metrics show cumulative count of Article Views (full-text article views including HTML views, PDF and ePub downloads, according to the available data) and Abstracts Views on Vision4Press platform.
Data correspond to usage on the plateform after 2015. The current usage metrics is available 48-96 hours after online publication and is updated daily on week days.
Initial download of the metrics may take a while.