Fig. 3.
Download original image
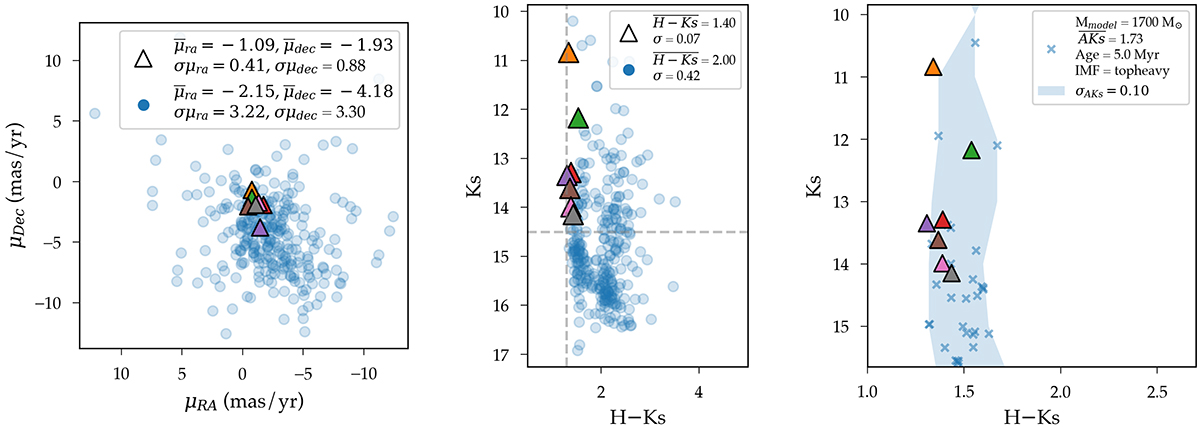
KMOS object proper motions and CMD, and cluster simulation. The triangles represent Can1, and the blue circles represent the remaining objects in the field. Left: vector-point diagram. Middle: CMD. The vertical dashed line marks the color-cut we made to exclude foreground stars (H − Ks = 1.3). The horizontal dashed line marks the magnitude cut we made to exclude stars with low spectroscopic S/R (Ks = 14.5). Right: Spisea cluster simulation. The blue crosses represent members of a simulated cluster. The legend box displays the main features of the cluster. The shaded area represents the uncertainty in the position in the CMD for the members of the simulated cluster due to variations in extinction.
Current usage metrics show cumulative count of Article Views (full-text article views including HTML views, PDF and ePub downloads, according to the available data) and Abstracts Views on Vision4Press platform.
Data correspond to usage on the plateform after 2015. The current usage metrics is available 48-96 hours after online publication and is updated daily on week days.
Initial download of the metrics may take a while.