Open Access
Fig. 8
Download original image
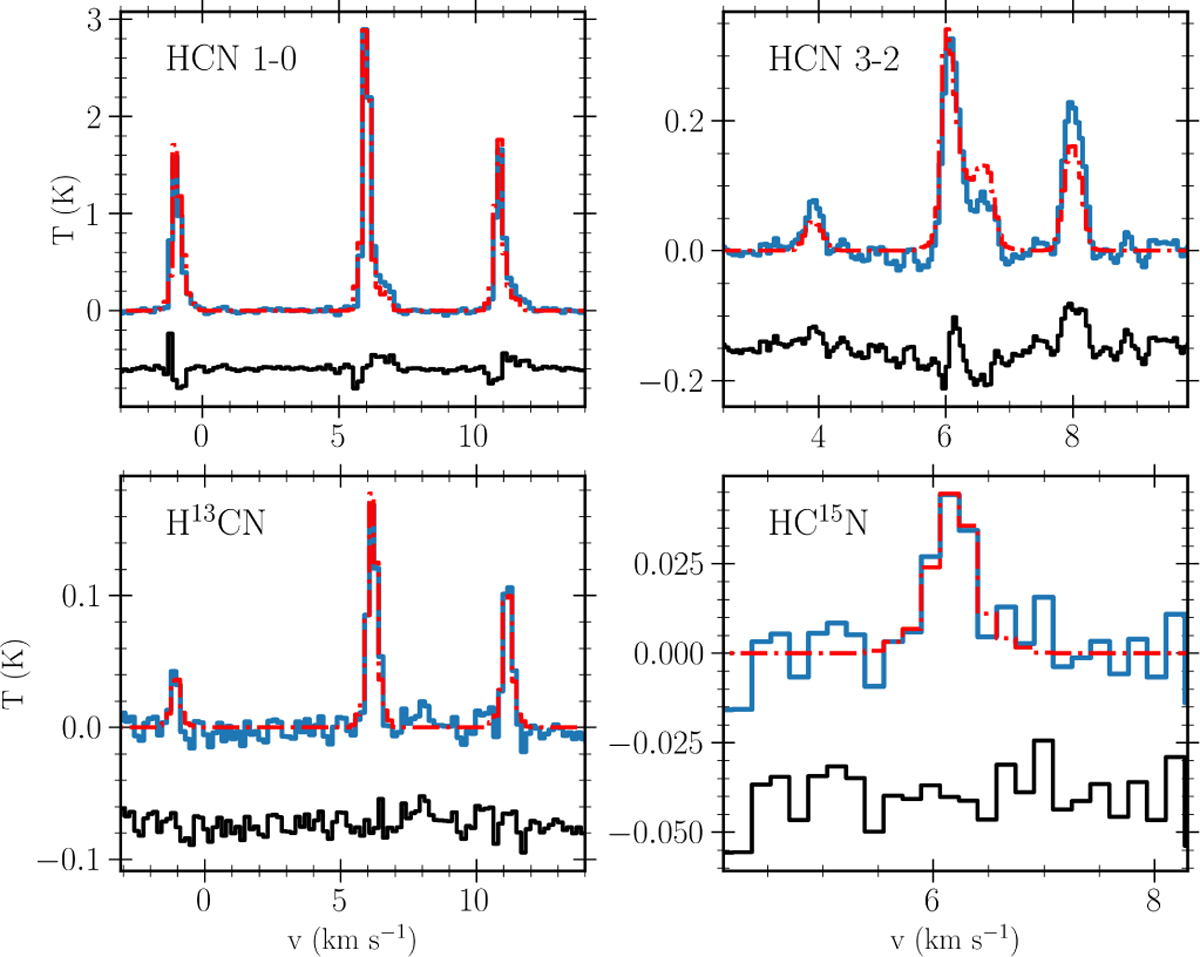
Comparison between the modeled and observed spectra for the three isotopologs toward TMC2. Each panel shows the 1D spectral model in red and the observed spectrum in blue. Residuals between the model and the data are shown in black, offset for clarity.
Current usage metrics show cumulative count of Article Views (full-text article views including HTML views, PDF and ePub downloads, according to the available data) and Abstracts Views on Vision4Press platform.
Data correspond to usage on the plateform after 2015. The current usage metrics is available 48-96 hours after online publication and is updated daily on week days.
Initial download of the metrics may take a while.