Open Access
Fig. 6
Download original image
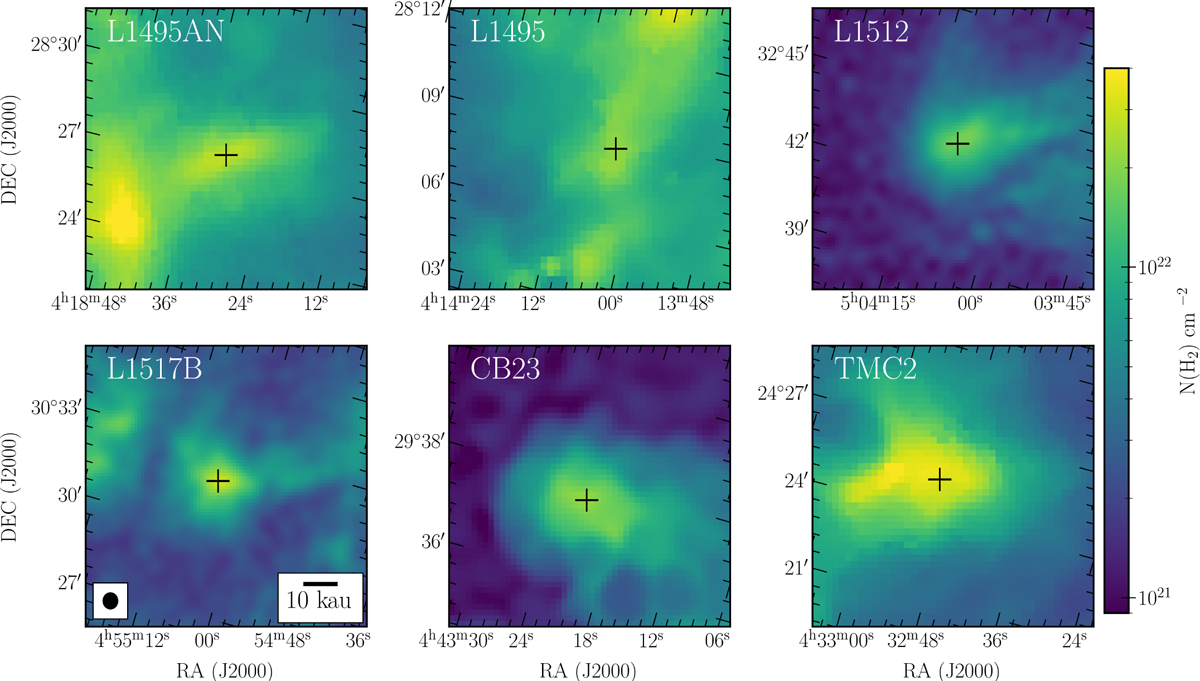
Column density maps of H2 derived from Herschel/SPIRE maps. The black cross marks the center of the core. The beam size is shown for the largest beam at 500 µm and identical for all the maps. A distance of 140 pc is assumed for all sources.
Current usage metrics show cumulative count of Article Views (full-text article views including HTML views, PDF and ePub downloads, according to the available data) and Abstracts Views on Vision4Press platform.
Data correspond to usage on the plateform after 2015. The current usage metrics is available 48-96 hours after online publication and is updated daily on week days.
Initial download of the metrics may take a while.