Open Access
Fig. 3
Download original image
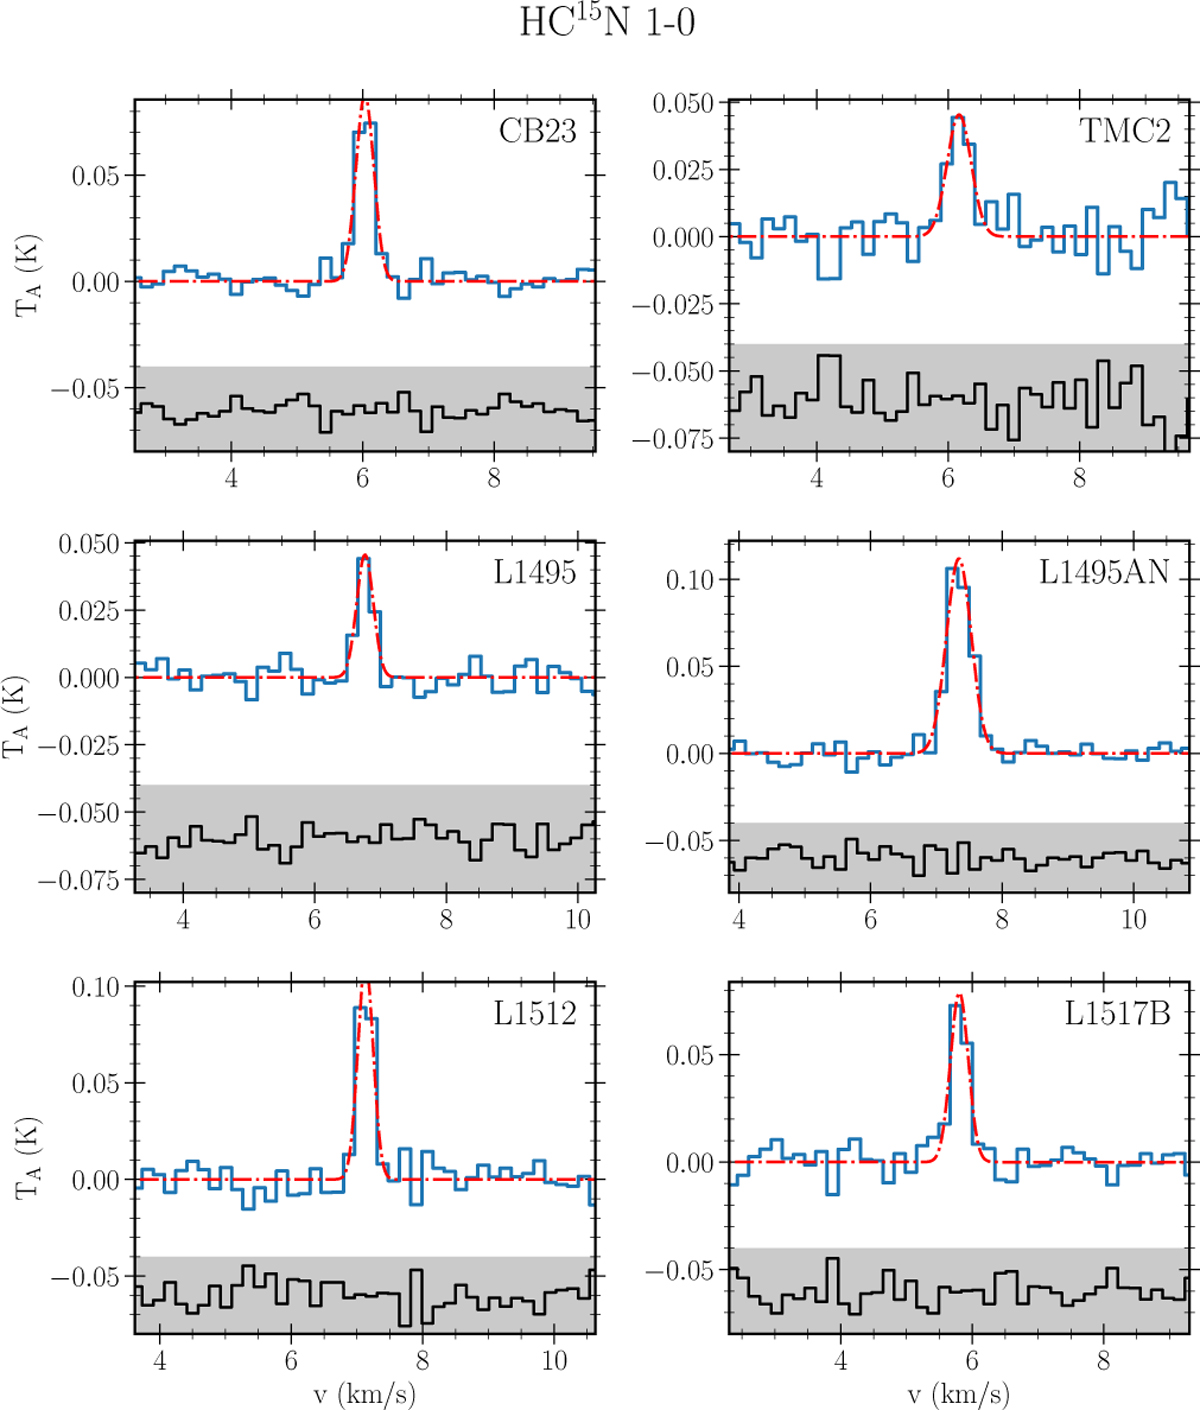
Observed spectra for the 1–0 transition of HC15N for the six cores. The best Gaussian fit to the emission line is shown in red and residuals between the fit and the observed spectra are shown in the shaded region (shifted for clarity).
Current usage metrics show cumulative count of Article Views (full-text article views including HTML views, PDF and ePub downloads, according to the available data) and Abstracts Views on Vision4Press platform.
Data correspond to usage on the plateform after 2015. The current usage metrics is available 48-96 hours after online publication and is updated daily on week days.
Initial download of the metrics may take a while.