Fig. 2
Download original image
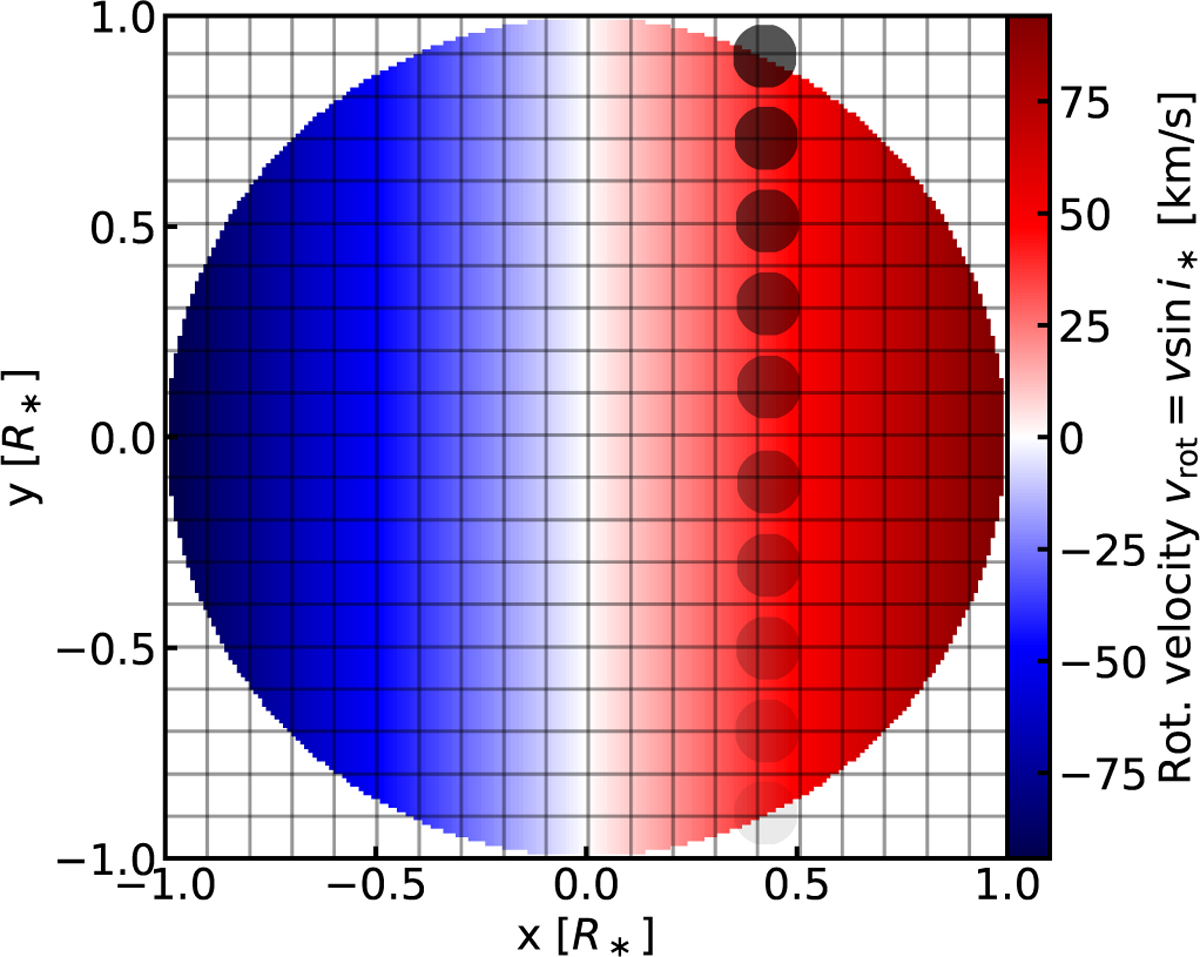
Orbital configuration based on best-fit parameters in Table 1. We used a grid size of 200 for StarRotator, which means that the whole plane is divided into 40 000 grid cells (200 in the x-direction, 200 in the y-direction). Every tenth grid line is indicated in grey. We plot only every fourth position of the planet during the observation sequence, in which the opacity of the planet increases with time to indicate the orbital direction. The rotational velocity, υrot, in this case corresponds to υ sin i*, as we do not fit for the stellar inclination, i*. The configuration shows only the positive λ scenario.
Current usage metrics show cumulative count of Article Views (full-text article views including HTML views, PDF and ePub downloads, according to the available data) and Abstracts Views on Vision4Press platform.
Data correspond to usage on the plateform after 2015. The current usage metrics is available 48-96 hours after online publication and is updated daily on week days.
Initial download of the metrics may take a while.