Fig. 9
Download original image
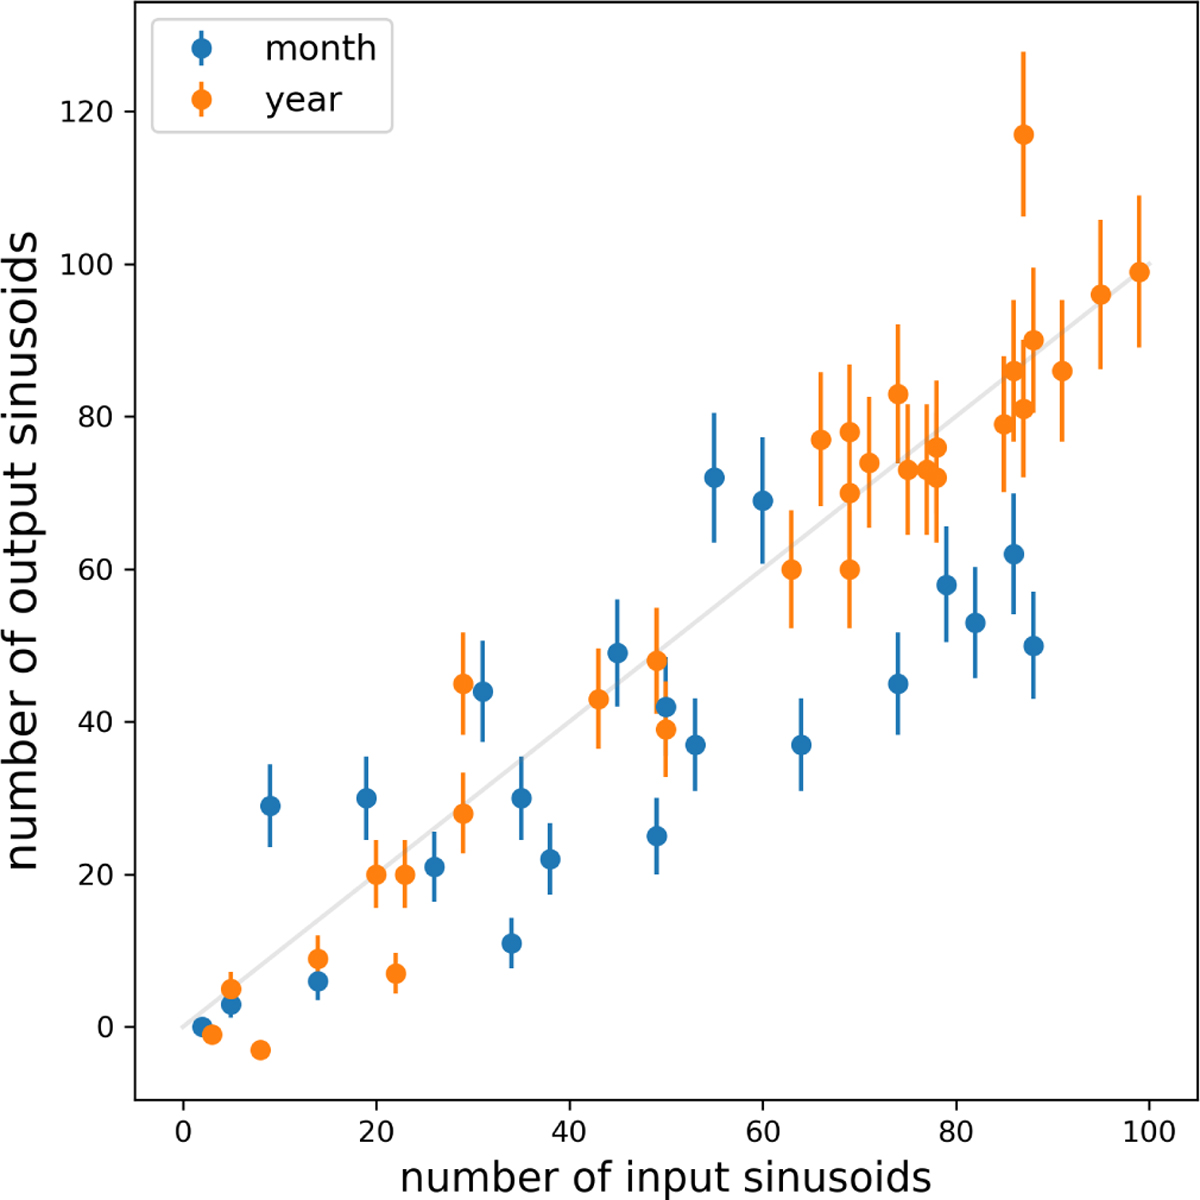
Number of extracted independent sinusoids (n – nh) versus the input number of sinusoids put into the light curve (ninput). Harmonic sinusoids are filtered out as they capture residuals related to the eclipse model that are unrelated to the number of input sinusoids. Points are divided into month-long time series (blue) and year-long time series (orange), and the error bars are calculated as the square root of the number n – nh.
Current usage metrics show cumulative count of Article Views (full-text article views including HTML views, PDF and ePub downloads, according to the available data) and Abstracts Views on Vision4Press platform.
Data correspond to usage on the plateform after 2015. The current usage metrics is available 48-96 hours after online publication and is updated daily on week days.
Initial download of the metrics may take a while.