Fig. 6
Download original image
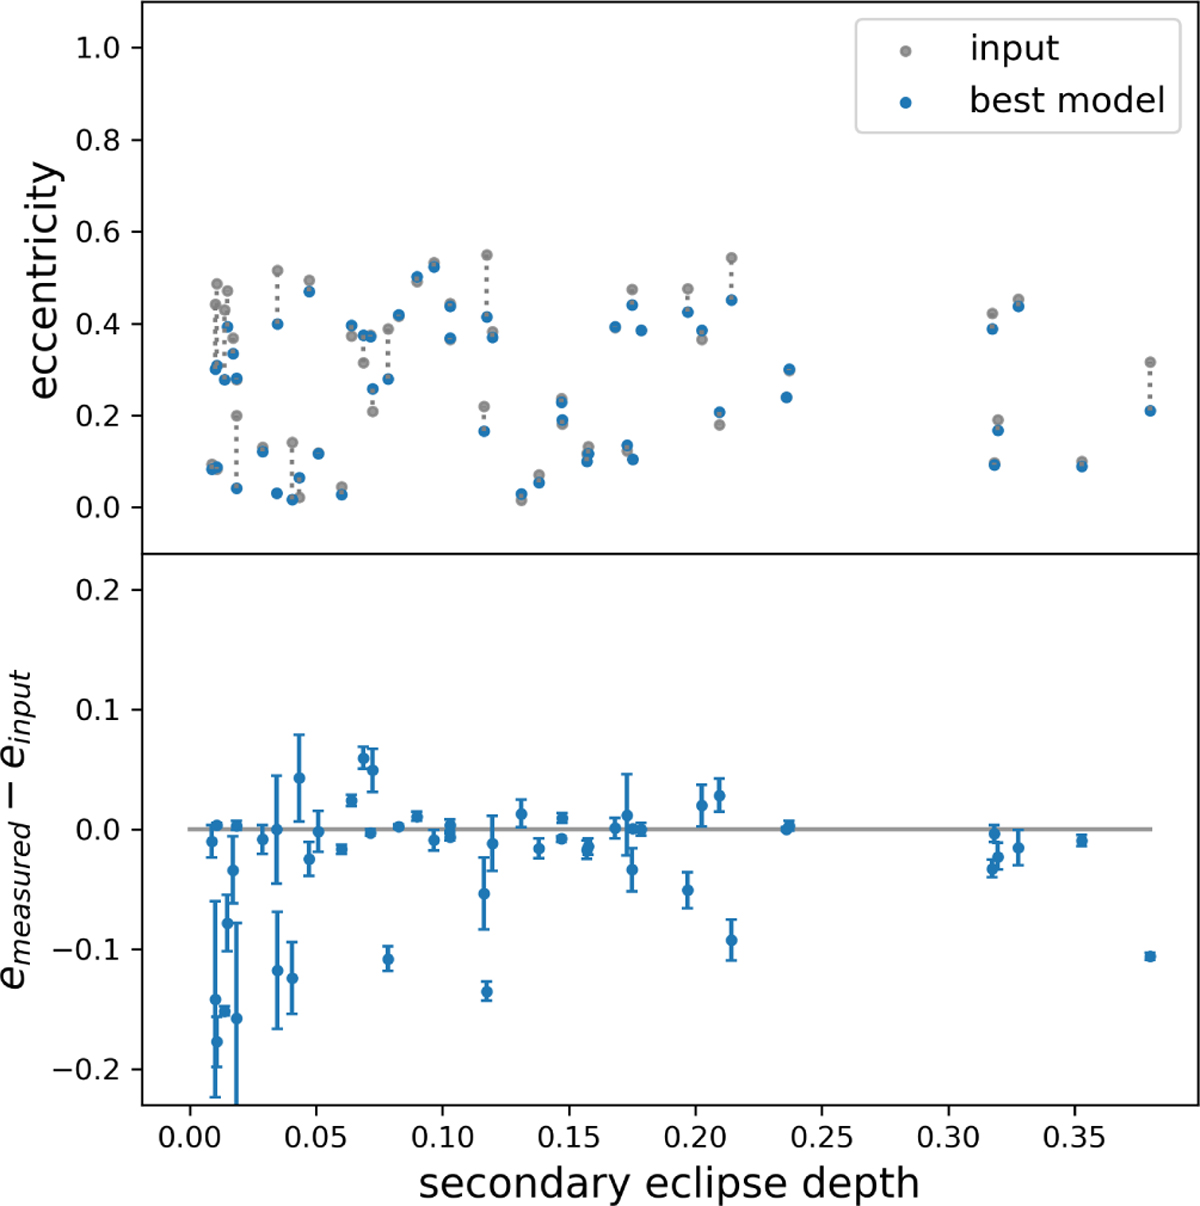
Eccentricity results for the synthetic test cases. Top panel: input (grey) and measured (coloured) eccentricities. Bottom panel: deviation from the input eccentricity against the secondary eclipse depth. The scatter in the bottom panel is seen to increase to the left, with decreasing eclipse depth, as the eccentricity depends critically on the identification and measurement of the secondary eclipse.
Current usage metrics show cumulative count of Article Views (full-text article views including HTML views, PDF and ePub downloads, according to the available data) and Abstracts Views on Vision4Press platform.
Data correspond to usage on the plateform after 2015. The current usage metrics is available 48-96 hours after online publication and is updated daily on week days.
Initial download of the metrics may take a while.