Open Access
Fig. D.30
Download original image
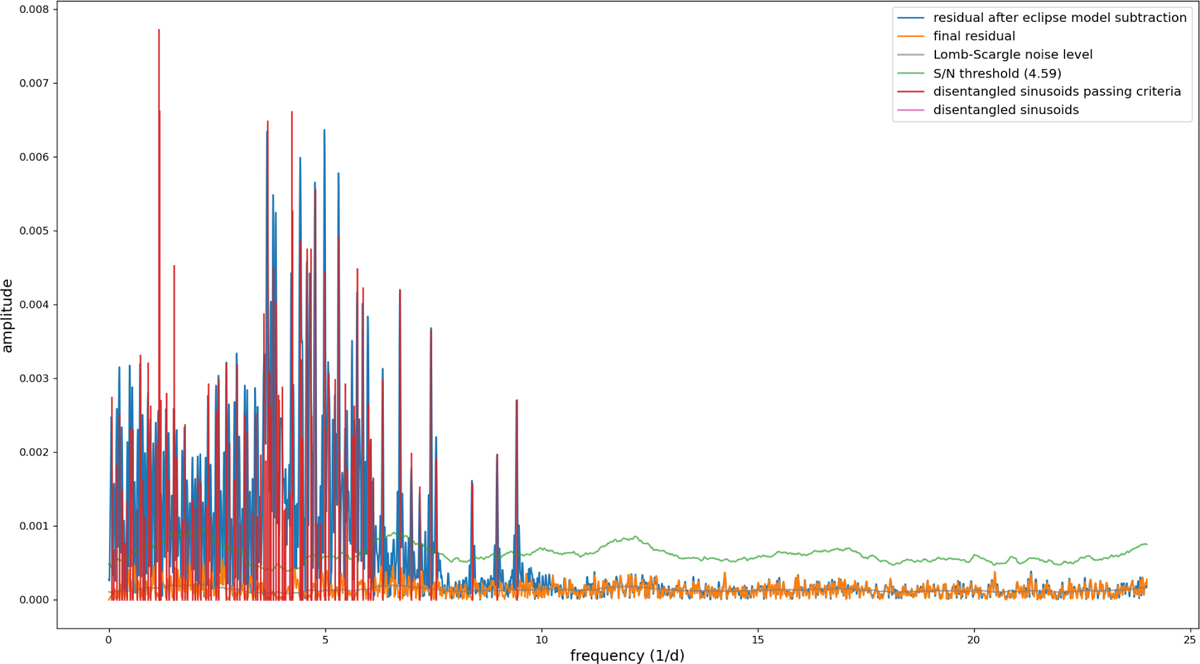
Fourier amplitude spectrum of case 7 after subtracting the eclipse model. In red are the extracted sinusoids that pass all criteria, including the signal-to-noise threshold shown in green (calculated in a window of 1d−1).
Current usage metrics show cumulative count of Article Views (full-text article views including HTML views, PDF and ePub downloads, according to the available data) and Abstracts Views on Vision4Press platform.
Data correspond to usage on the plateform after 2015. The current usage metrics is available 48-96 hours after online publication and is updated daily on week days.
Initial download of the metrics may take a while.