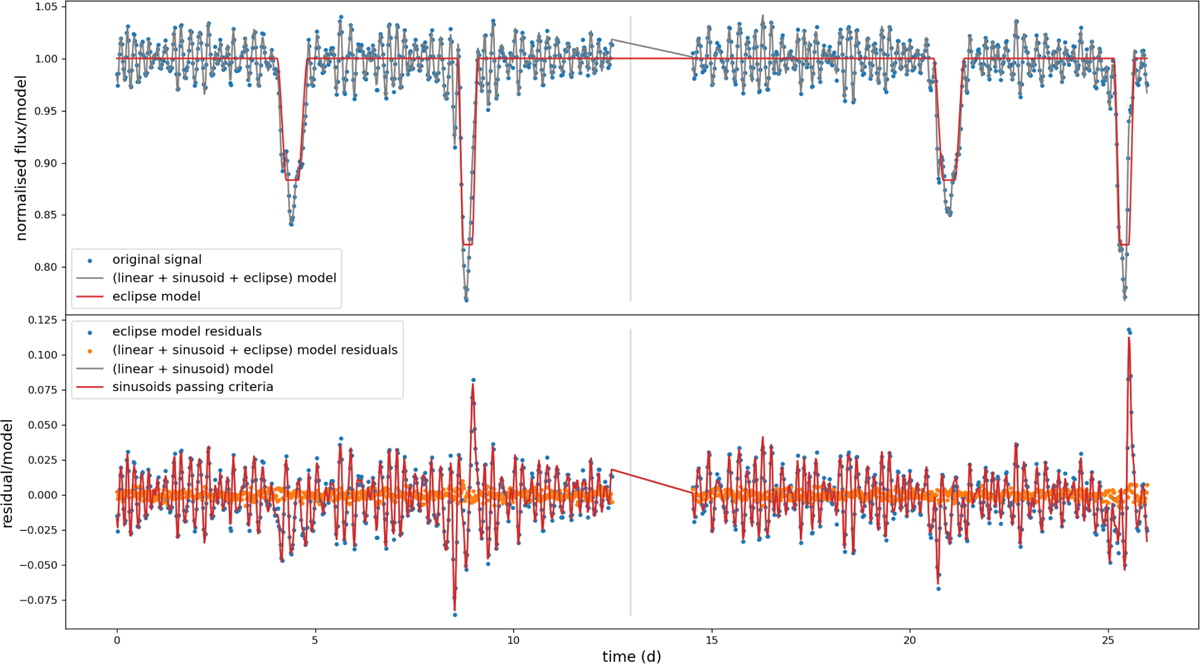
Fig. D.28
Download original image
Example (full) synthetic light curve of case 7. The top panel shows the final eclipse model of the eclipses in red and the full model of the light curve including sinusoids in grey. The bottom panel shows the residuals of subtracting the eclipse model (blue) and those of subtracting the full model (orange). The model of sinusoids is also plotted separately in red here. The slight overestimation of the primary eclipse width can be identified by sharp residual peaks here and leads to an underestimation of the radial part of eccentricity of about 0.2 for this case.
Current usage metrics show cumulative count of Article Views (full-text article views including HTML views, PDF and ePub downloads, according to the available data) and Abstracts Views on Vision4Press platform.
Data correspond to usage on the plateform after 2015. The current usage metrics is available 48-96 hours after online publication and is updated daily on week days.
Initial download of the metrics may take a while.