Fig. 3
Download original image
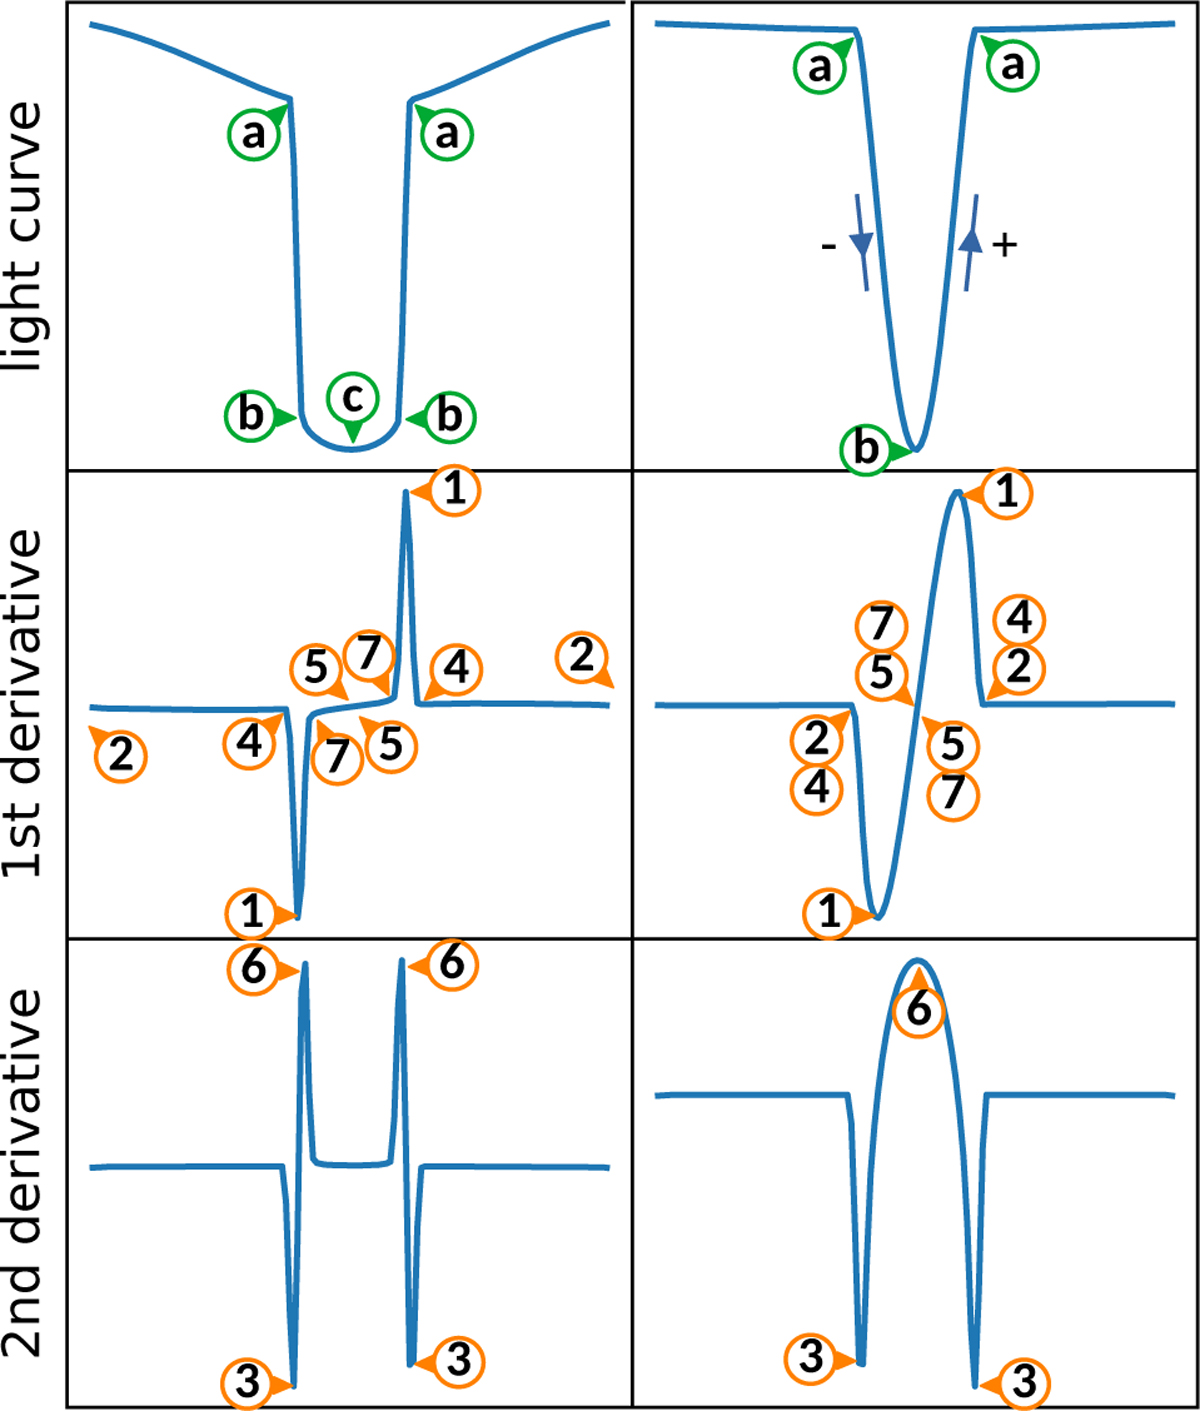
Typical eclipse signatures in the derivatives of the light curve, with markers pointing to important features for the automated eclipse detection and timing measurement. Note that points 7 in the left panel of first derivatives are not truly local minima but marked as such for illustrative purposes. Adapted with permission from IJspeert et al. (2021).
Current usage metrics show cumulative count of Article Views (full-text article views including HTML views, PDF and ePub downloads, according to the available data) and Abstracts Views on Vision4Press platform.
Data correspond to usage on the plateform after 2015. The current usage metrics is available 48-96 hours after online publication and is updated daily on week days.
Initial download of the metrics may take a while.