Fig. D.1
Download original image
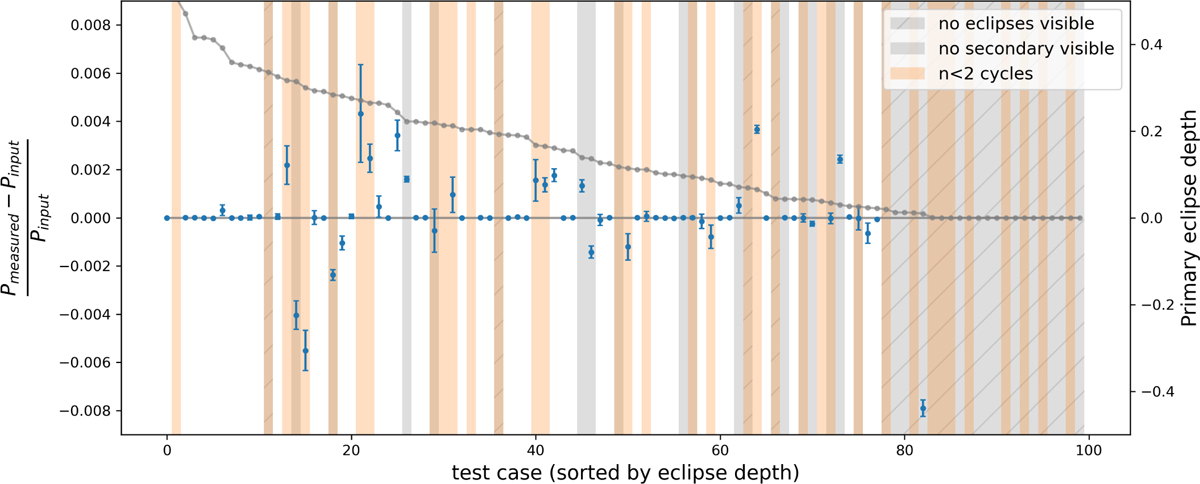
Performance of the period search algorithm as a function of the primary eclipse depth. Blue points with error bars show the fractional difference between the measured and the input orbital period with SLR error estimates, sorted by descending primary eclipse depth. The grey line with points shows primary eclipse depths, plotted on the right axis. Note that cases shaded grey and hatched do not show eclipses, and cases shaded orange have fewer than three eclipse cycles.
Current usage metrics show cumulative count of Article Views (full-text article views including HTML views, PDF and ePub downloads, according to the available data) and Abstracts Views on Vision4Press platform.
Data correspond to usage on the plateform after 2015. The current usage metrics is available 48-96 hours after online publication and is updated daily on week days.
Initial download of the metrics may take a while.