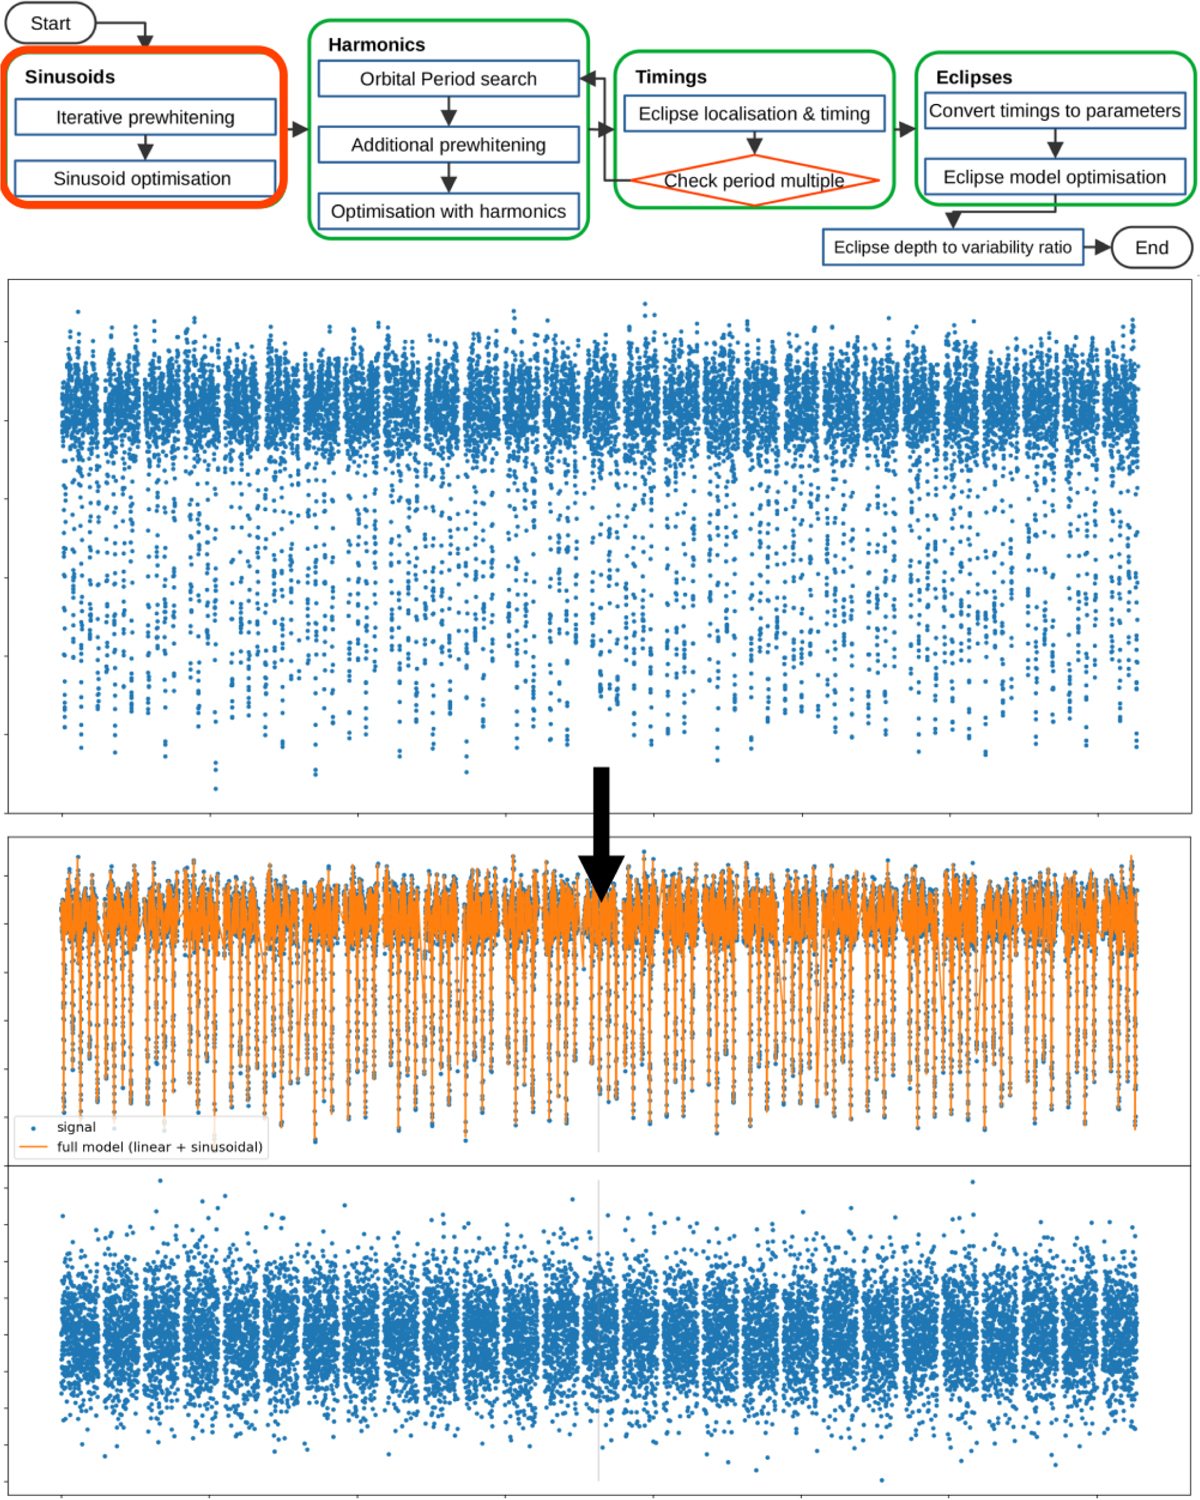
Fig. B.1
Download original image
'Sinusoid' part of the analysis. The input light curve is iteratively pre-whitened, and the resulting parameters are non-linearly optimised. This step results in a mathematical model of the light curve in terms of a sum of sine waves and a linear trend for each sector (separately) and is applicable to any time series. In the second to last panel is the sum of sinusoids light curve model in orange and the bottom panel shows the residuals.
Current usage metrics show cumulative count of Article Views (full-text article views including HTML views, PDF and ePub downloads, according to the available data) and Abstracts Views on Vision4Press platform.
Data correspond to usage on the plateform after 2015. The current usage metrics is available 48-96 hours after online publication and is updated daily on week days.
Initial download of the metrics may take a while.