Fig. 17
Download original image
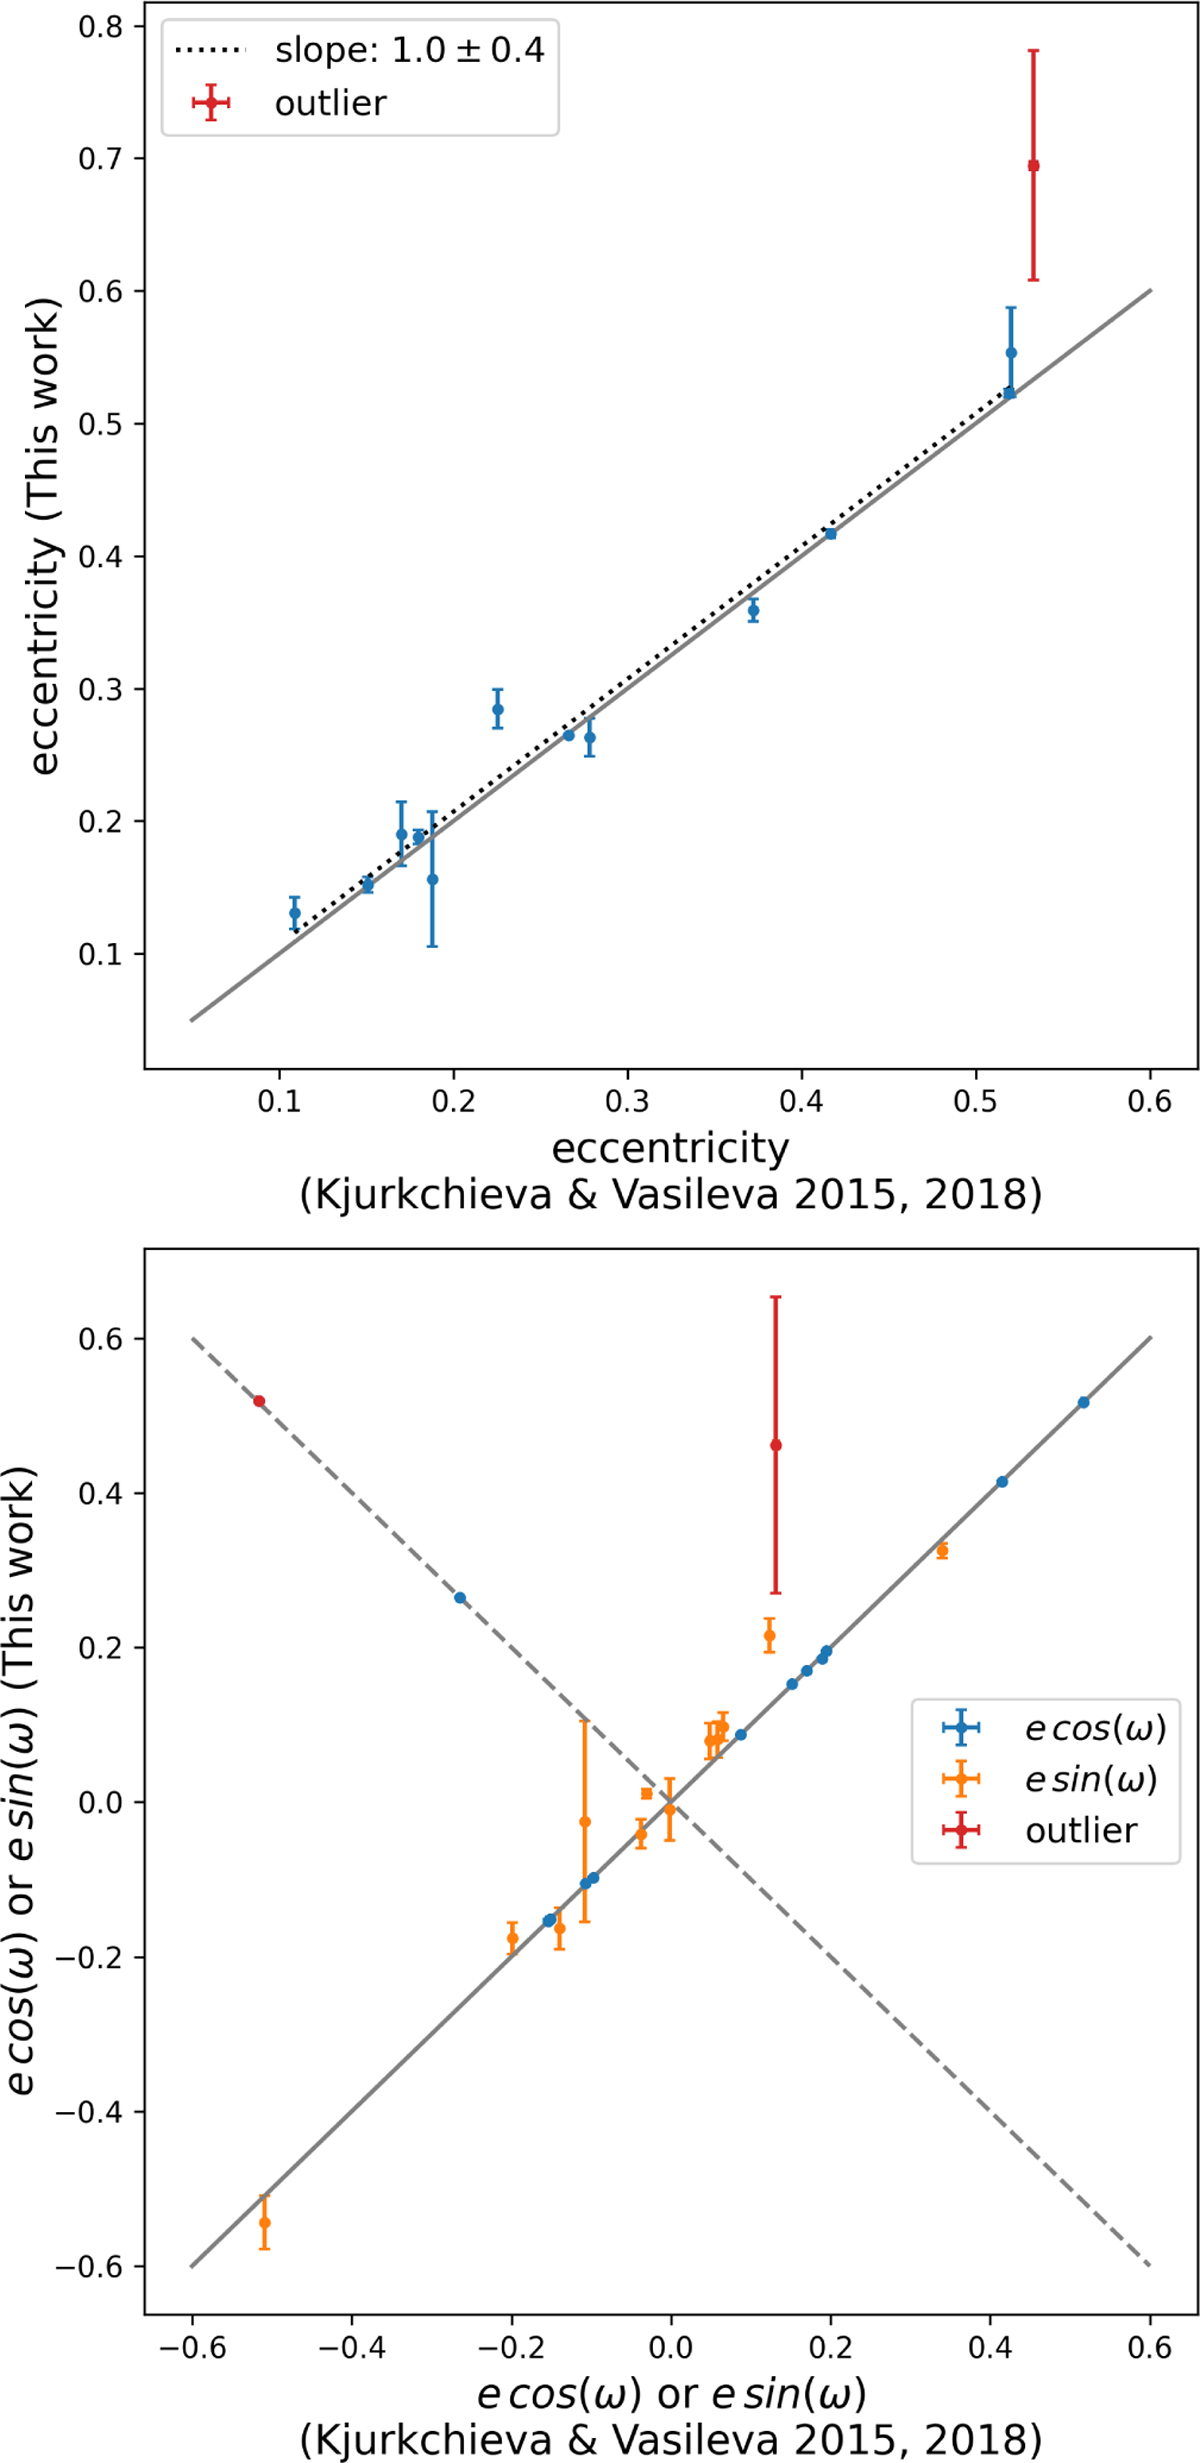
Comparison of eccentricity measurements for 13 Kepler targets. Top panel: eccentricity measurements from this work versus those obtained in Kjurkchieva & Vasileva (2015, 2018), along the diagonal (grey line). The linear regression model is plotted as a black dotted line. Bottom panel: comparison between the tangential and radial components of eccentricity. The dashed line indicates where points occur if the definition of primary and secondary eclipse is swapped.
Current usage metrics show cumulative count of Article Views (full-text article views including HTML views, PDF and ePub downloads, according to the available data) and Abstracts Views on Vision4Press platform.
Data correspond to usage on the plateform after 2015. The current usage metrics is available 48-96 hours after online publication and is updated daily on week days.
Initial download of the metrics may take a while.