Fig. 10
Download original image
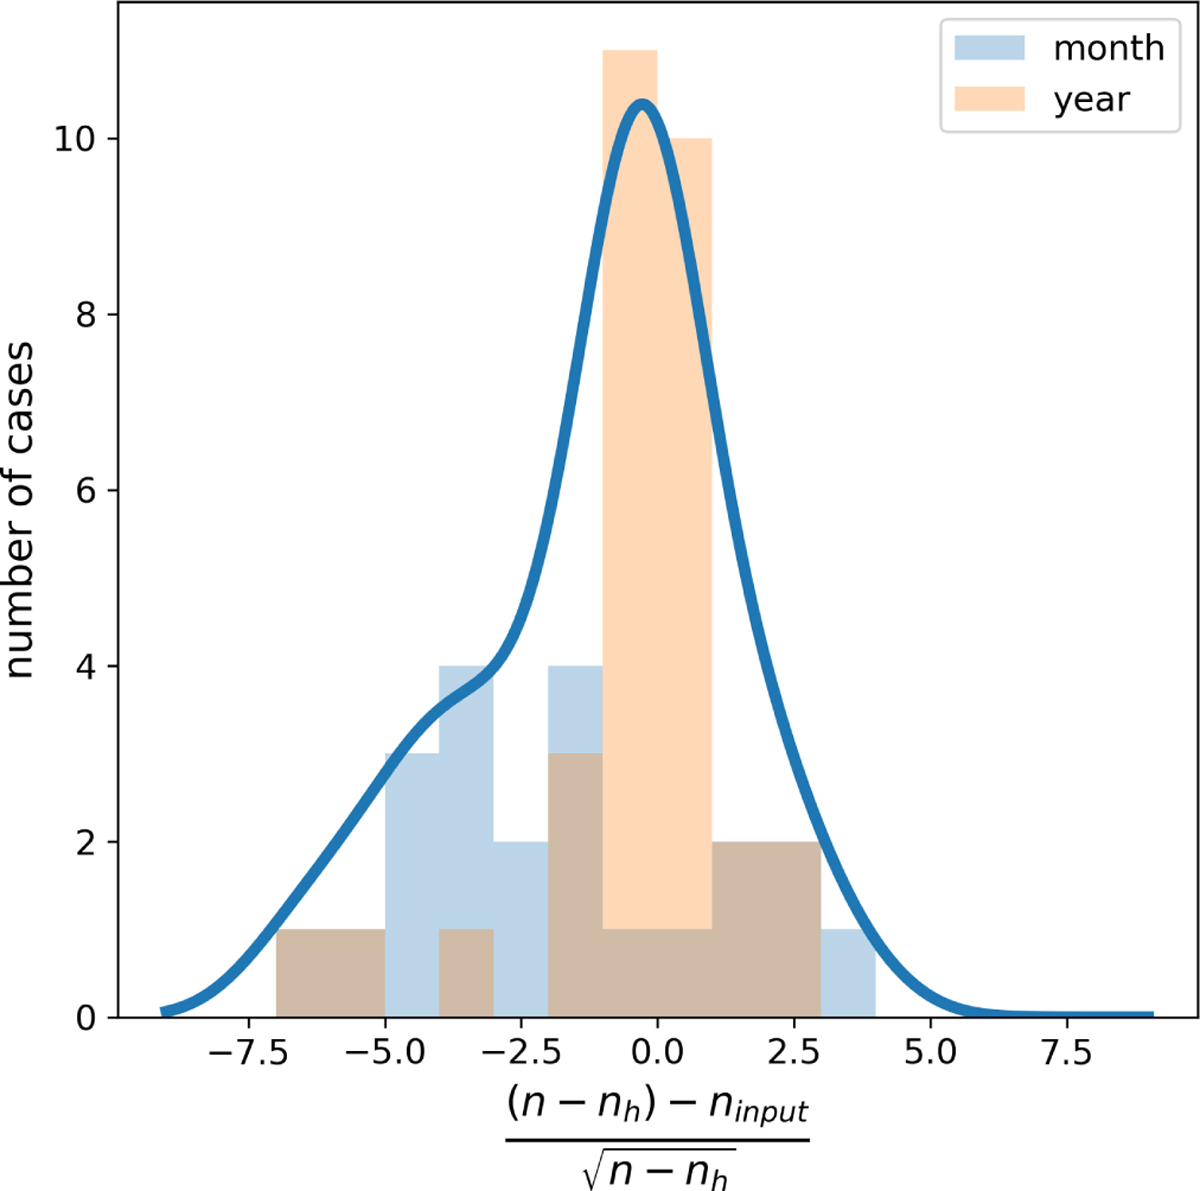
Histogram and KDE of the χ values of the number of sinusoids. Errors are taken to be the square root of the amount (n – nh). The histogram is split into light curves of a month in length and those of a year in length: the shorter time base tends to lead to an underestimation of the number of sinusoids present. The KDE is scaled to the height of the histogram.
Current usage metrics show cumulative count of Article Views (full-text article views including HTML views, PDF and ePub downloads, according to the available data) and Abstracts Views on Vision4Press platform.
Data correspond to usage on the plateform after 2015. The current usage metrics is available 48-96 hours after online publication and is updated daily on week days.
Initial download of the metrics may take a while.