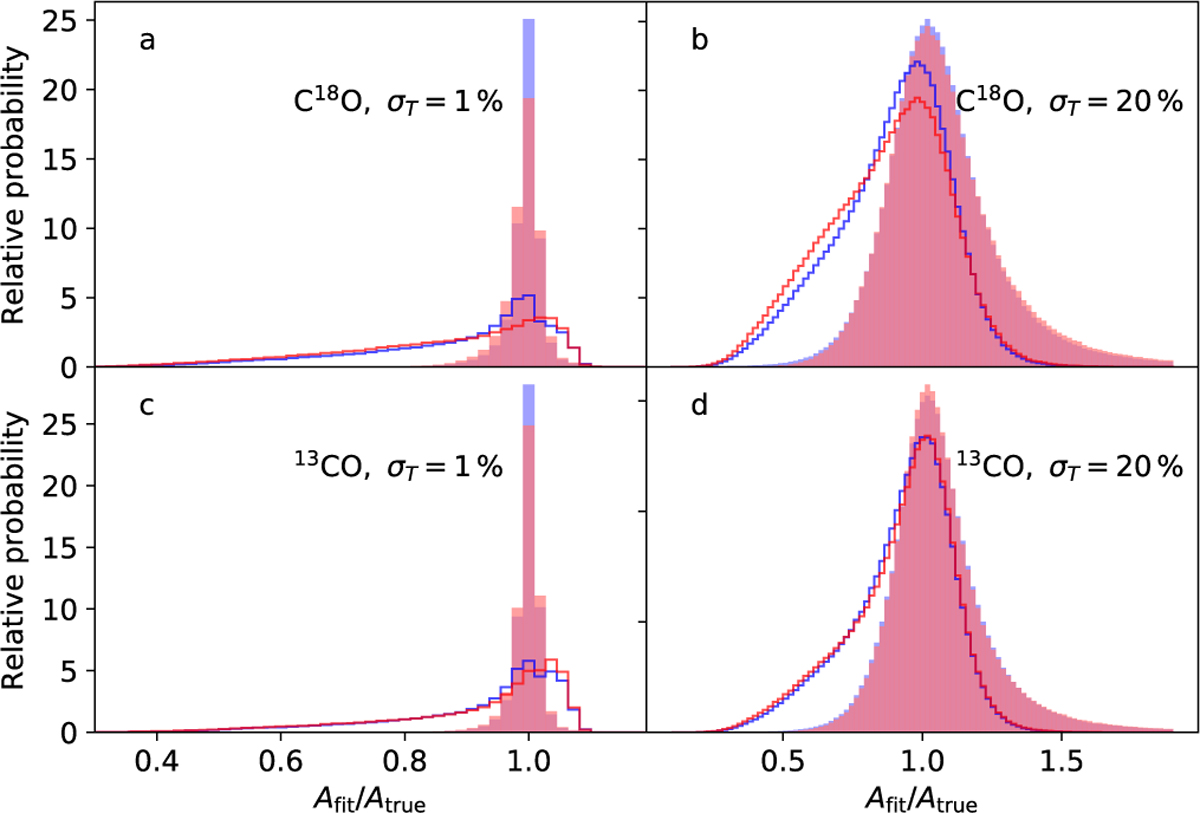
Fig. 8
Download original image
Line areas from Gaussian fits versus the true line area. Results are shown for C18O and 13CO (upper and lower frames, respectively) and for noise levels of σT = 1 % and σT = 10% of the peak value in each spectrum (left and right frames, respectively). The blue histograms contain all spectra with Tmax > 10 mK and the red histograms the strongest spectra with Tmax > 1 K. The unfilled histograms correspond to single-component fits and the filled histograms to one to three component fits, where the number of components was selected based on the AIC criterion.
Current usage metrics show cumulative count of Article Views (full-text article views including HTML views, PDF and ePub downloads, according to the available data) and Abstracts Views on Vision4Press platform.
Data correspond to usage on the plateform after 2015. The current usage metrics is available 48-96 hours after online publication and is updated daily on week days.
Initial download of the metrics may take a while.