Fig. 7
Download original image
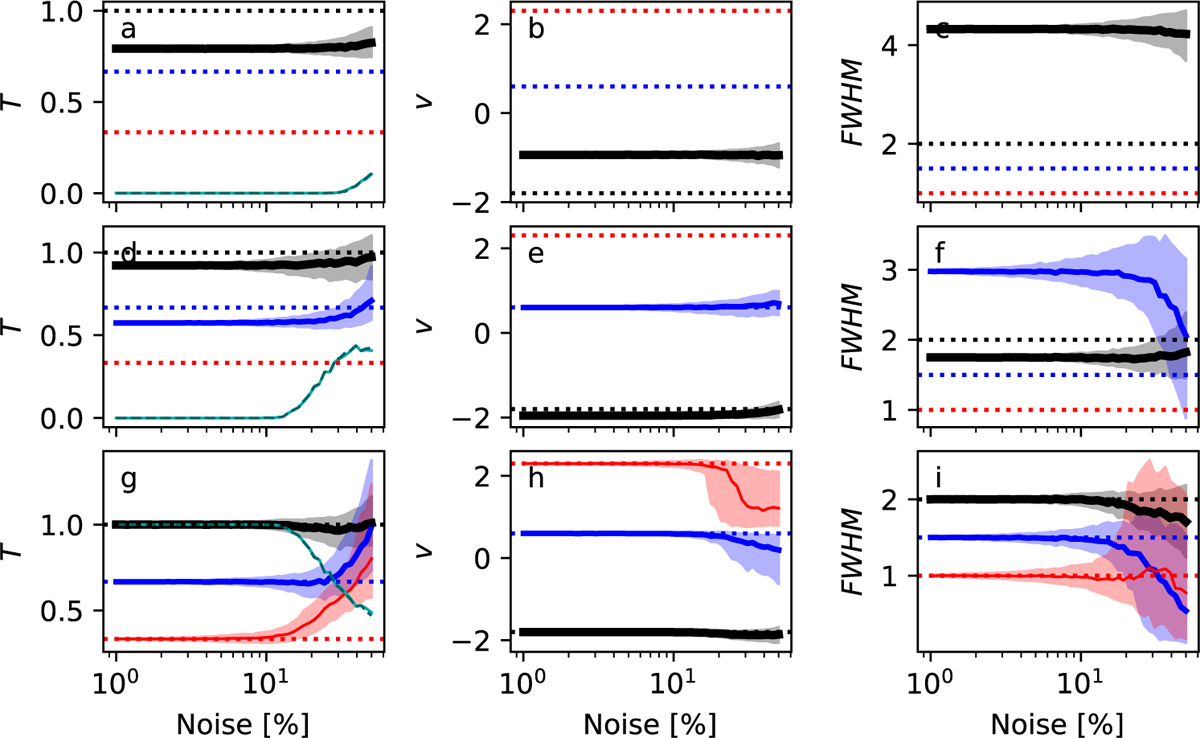
Accuracy of fit parameters in the case of spectra with three Gaussian components. The three rows of frames correspond to the one to three component fits. The solid black, blue, and red lines show the median of the parameter estimates as a function of the noise level, and the shaded areas of the same colour show the inter-quartile ranges. The dotted horizontal lines correspond to the true values. In the frames a, d, and g, the light cyan lines show the fraction of cases where AIC preferred fits with the corresponding number components (i.e. one, two, or three). The dashed dark cyan lines are the same after 40 channels without significant emission were excluded, but these overlap almost perfectly with the previous cyan lines.
Current usage metrics show cumulative count of Article Views (full-text article views including HTML views, PDF and ePub downloads, according to the available data) and Abstracts Views on Vision4Press platform.
Data correspond to usage on the plateform after 2015. The current usage metrics is available 48-96 hours after online publication and is updated daily on week days.
Initial download of the metrics may take a while.