Open Access
Fig. 5
Download original image
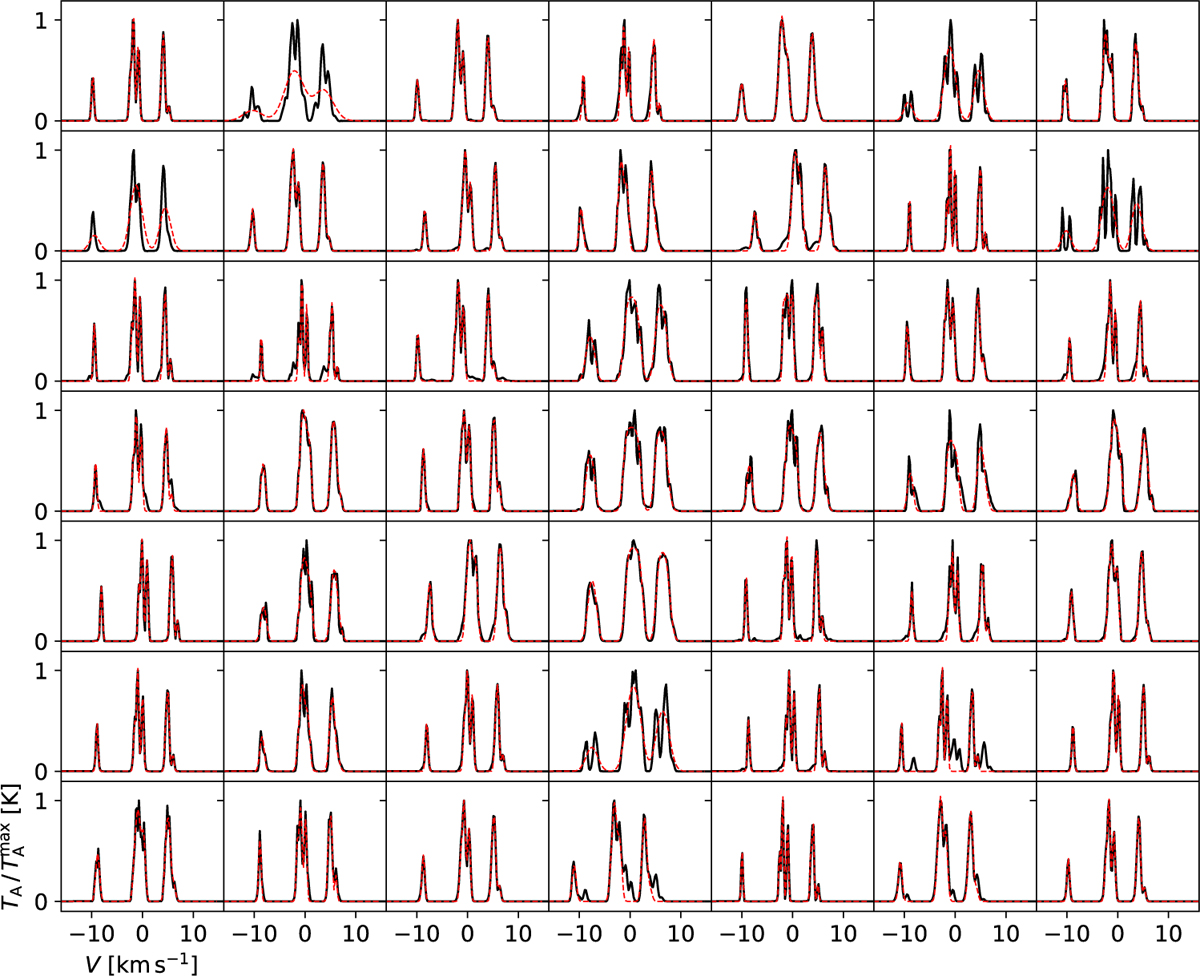
Examples of synthetic N2H+ spectra (solid black lines) and the fitted hyperfine profiles (dashed red lines). The spectra are for direction x, R = 8, and without added observational noise. The y-axis of each frame was scaled independently, and the shown TA axis values apply to the leftmost frames only.
Current usage metrics show cumulative count of Article Views (full-text article views including HTML views, PDF and ePub downloads, according to the available data) and Abstracts Views on Vision4Press platform.
Data correspond to usage on the plateform after 2015. The current usage metrics is available 48-96 hours after online publication and is updated daily on week days.
Initial download of the metrics may take a while.