Fig. 3
Download original image
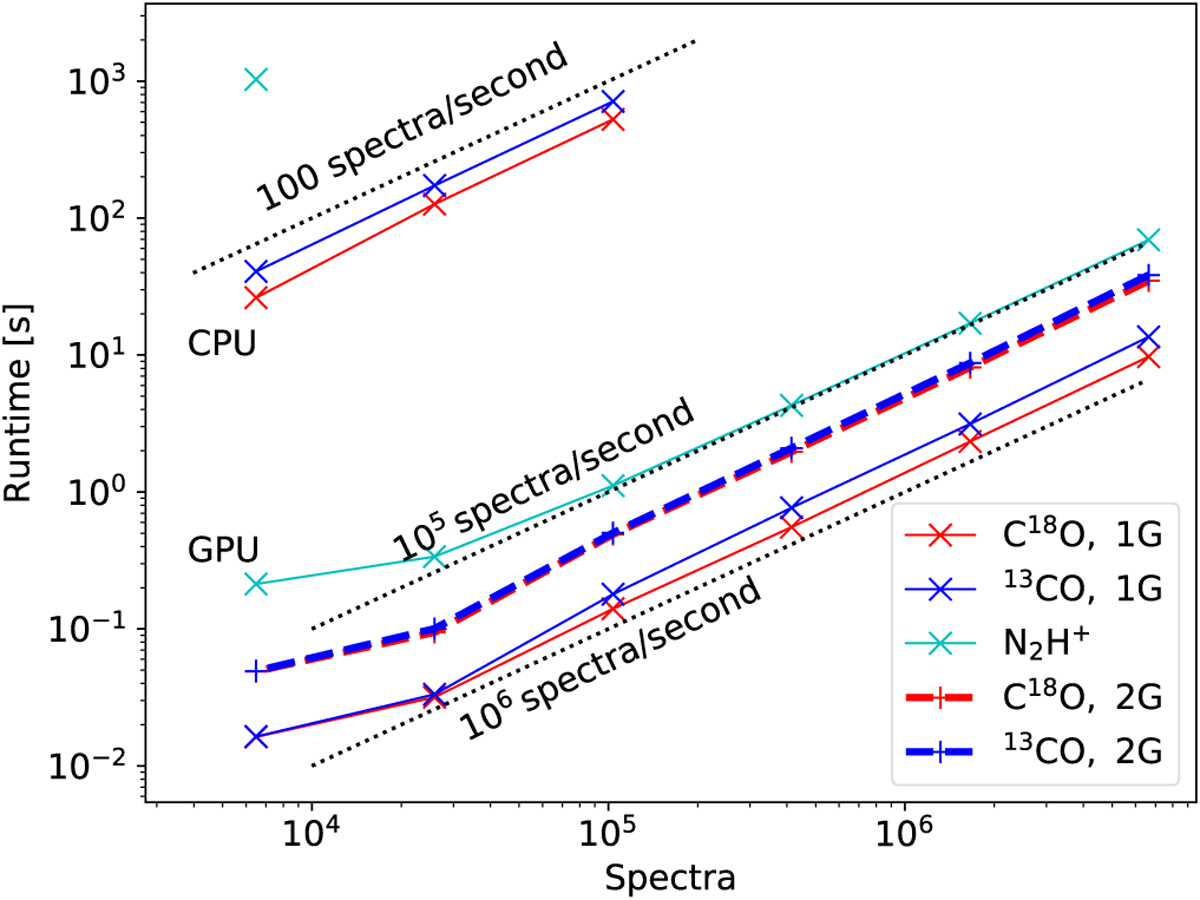
Runtimes of Gaussian and hyperfine fits. Results are shown for Gaussian fits to C18O (red lines) and 13CO (blue lines) spectra and for hyperfine fits to N2H+ spectra (cyan lines). The CPU speeds are slightly below (i.e. faster) than the dotted line for 100 spectra per second. The GPU fits are in the range of 105–106 spectra per second. In the legend, 1G and 2G refer to fits with one or two Gaussian components, respectively. The timings correspond to the x view direction, but the runtimes are nearly identical for the other view directions.
Current usage metrics show cumulative count of Article Views (full-text article views including HTML views, PDF and ePub downloads, according to the available data) and Abstracts Views on Vision4Press platform.
Data correspond to usage on the plateform after 2015. The current usage metrics is available 48-96 hours after online publication and is updated daily on week days.
Initial download of the metrics may take a while.