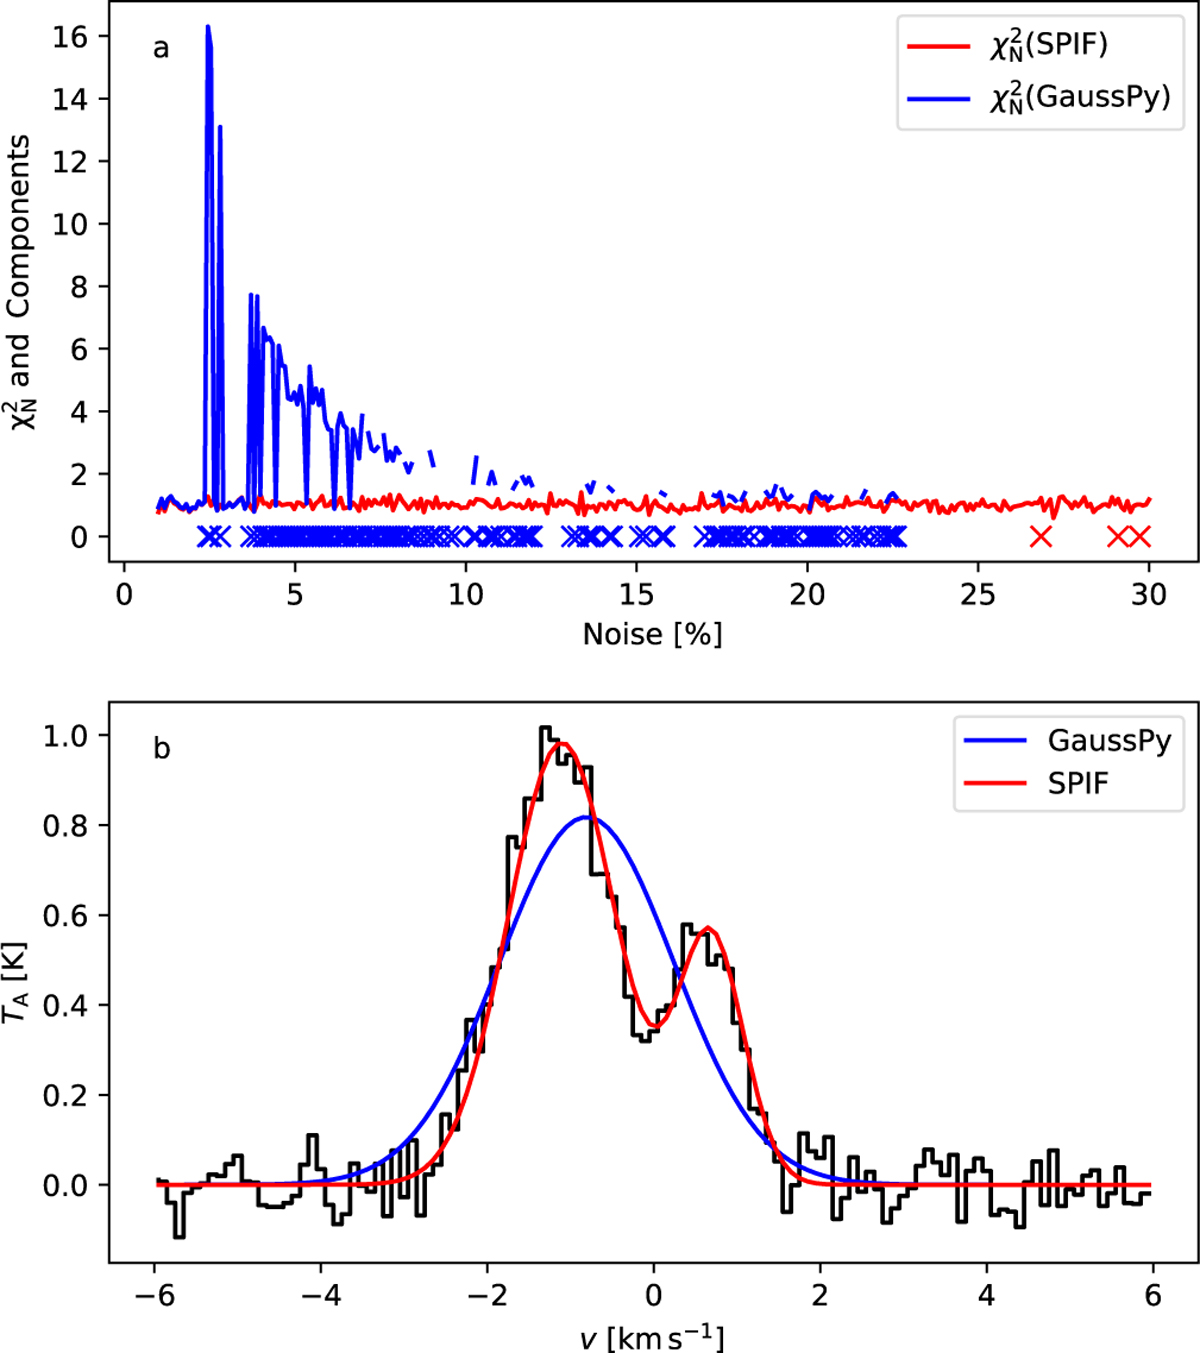
Fig. C.1
Download original image
Fit to spectra containing two Gaussian components and with noise varied from 1% to 30%. The upper frame shows the reduced χ2 values for GaussPy (blue line) and SPIF (red line) fits. The crosses indicate cases where programs have preferred the single-component fit. Some GaussPy fits have failed, and in those cases no χ2 value is plotted. In the case of GaussPy, we modelled the parameter using smoothing parameters α ~ δv for noise ≤ 16% and α ~ 40 × δv for noise > 16%. A fixed smoothing parameter for varying noise levels prevents GaussPy from isolating the multiple components. In the case of SPIF, both one-and two-component fits were performed and the model with the lower AIC values is included in the figure. The lower frame shows one example where GaussPy (blue line) has opted for a single-component fit, resulting in a noticeably higher χ1 value in frame a.
Current usage metrics show cumulative count of Article Views (full-text article views including HTML views, PDF and ePub downloads, according to the available data) and Abstracts Views on Vision4Press platform.
Data correspond to usage on the plateform after 2015. The current usage metrics is available 48-96 hours after online publication and is updated daily on week days.
Initial download of the metrics may take a while.