Fig. 24
Download original image
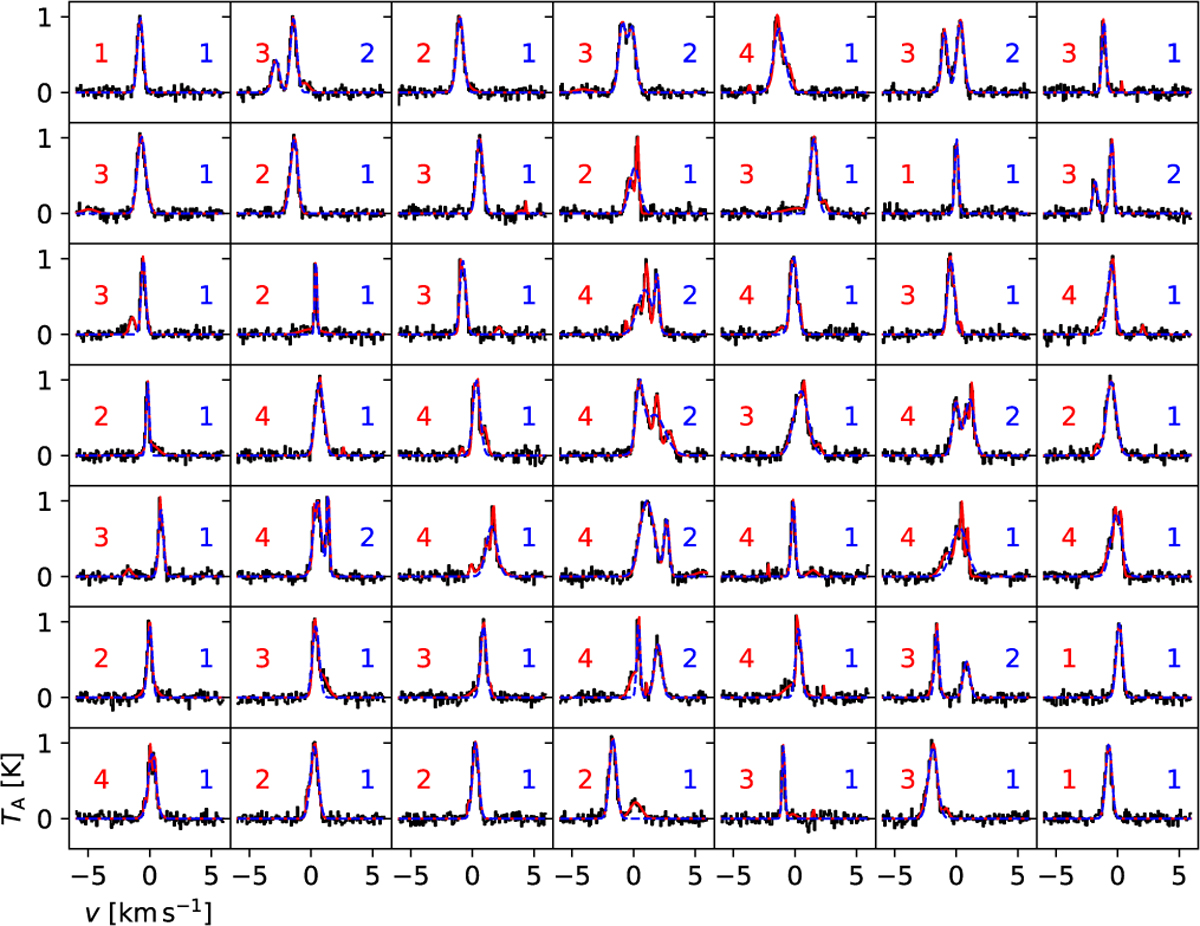
Sample C18O spectra from the MHD model, taken at equidistant positions over the area shown in Fig. 23. The black line shows the synthetic observations with noise equal to σ(T) = 0.05 K. The solid red and dashed blue curves correspond to the SPIF and GaussPy fits, respectively. The number of Gaussian components selected by the methods are indicated in the frames with numbers of the corresponding colour.
Current usage metrics show cumulative count of Article Views (full-text article views including HTML views, PDF and ePub downloads, according to the available data) and Abstracts Views on Vision4Press platform.
Data correspond to usage on the plateform after 2015. The current usage metrics is available 48-96 hours after online publication and is updated daily on week days.
Initial download of the metrics may take a while.