Fig. 23
Download original image
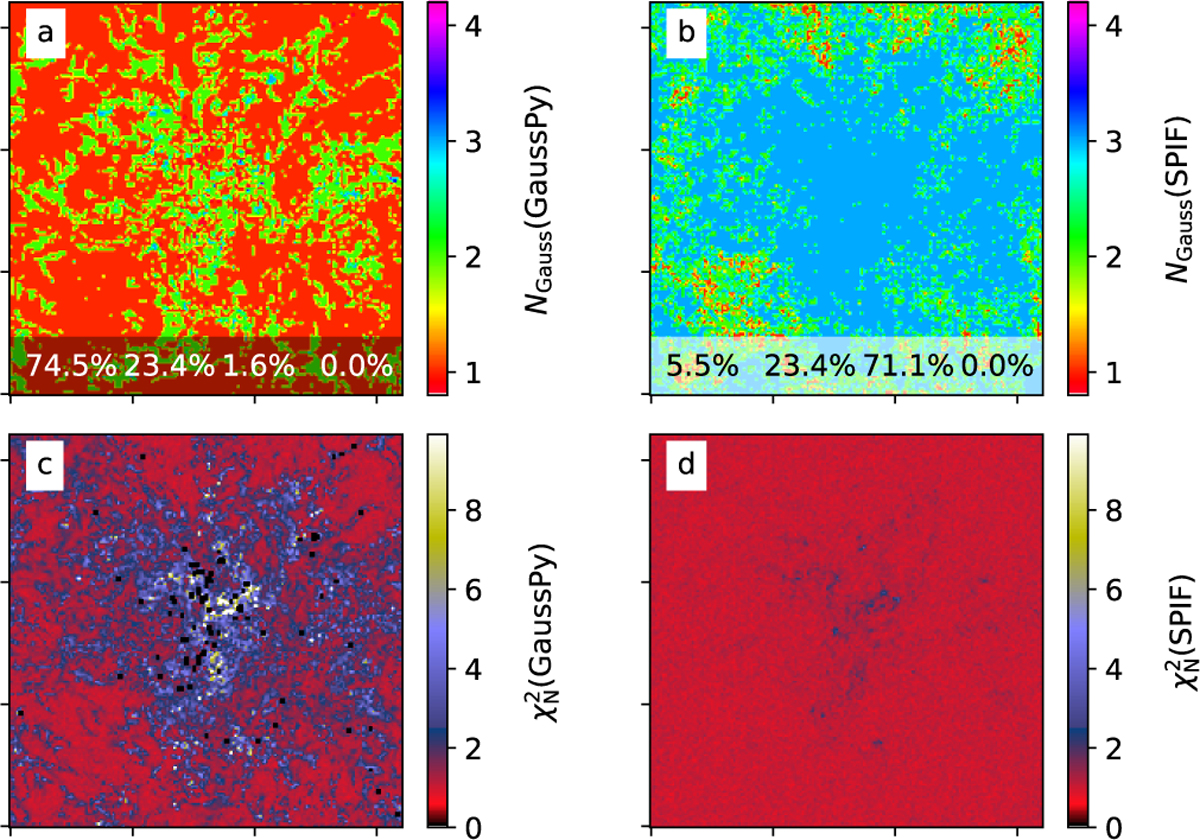
Comparison of GaussPy (left frames) and SPIF (right frames) fits of the C180 spectra of the MHD model. The map resolution is R = 16 and the view direction x. The upper frames show the number of Gaussian components selected by the programs, with the fraction of spectra fitted with one to four components listed within the frames. The lower frames show the corresponding ![]() values.
values.
Current usage metrics show cumulative count of Article Views (full-text article views including HTML views, PDF and ePub downloads, according to the available data) and Abstracts Views on Vision4Press platform.
Data correspond to usage on the plateform after 2015. The current usage metrics is available 48-96 hours after online publication and is updated daily on week days.
Initial download of the metrics may take a while.