Fig. 21
Download original image
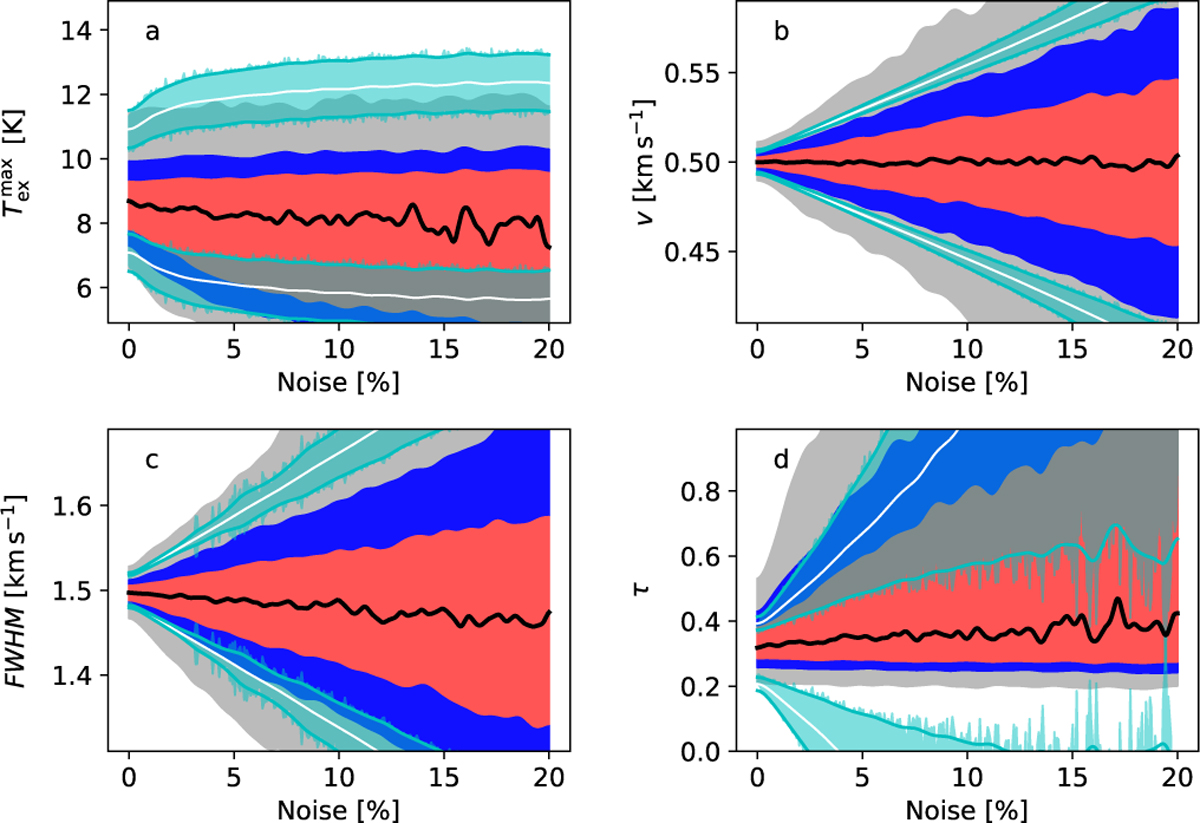
Distribution of best-fit parameters and their error estimates in the case of synthetic N2H+ spectra from the cloud simulation. The sample consists of 100 spectra for each of the 322 noise levels. The black lines show the median parameter estimates, and the shaded red, blue, and grey areas correspond to the [20, 75], [10, 90], and [0.1, 99,9] percentiles of the parameter estimates, respectively. The median Monte Carlo error estimates are shown with solid white curves, and the 1-σ variation of the error estimates (between spectra at the same noise level) with cyan shaded regions. The error estimates are plotted symmetrically relative to the true parameter values.
Current usage metrics show cumulative count of Article Views (full-text article views including HTML views, PDF and ePub downloads, according to the available data) and Abstracts Views on Vision4Press platform.
Data correspond to usage on the plateform after 2015. The current usage metrics is available 48-96 hours after online publication and is updated daily on week days.
Initial download of the metrics may take a while.