Fig. 2
Download original image
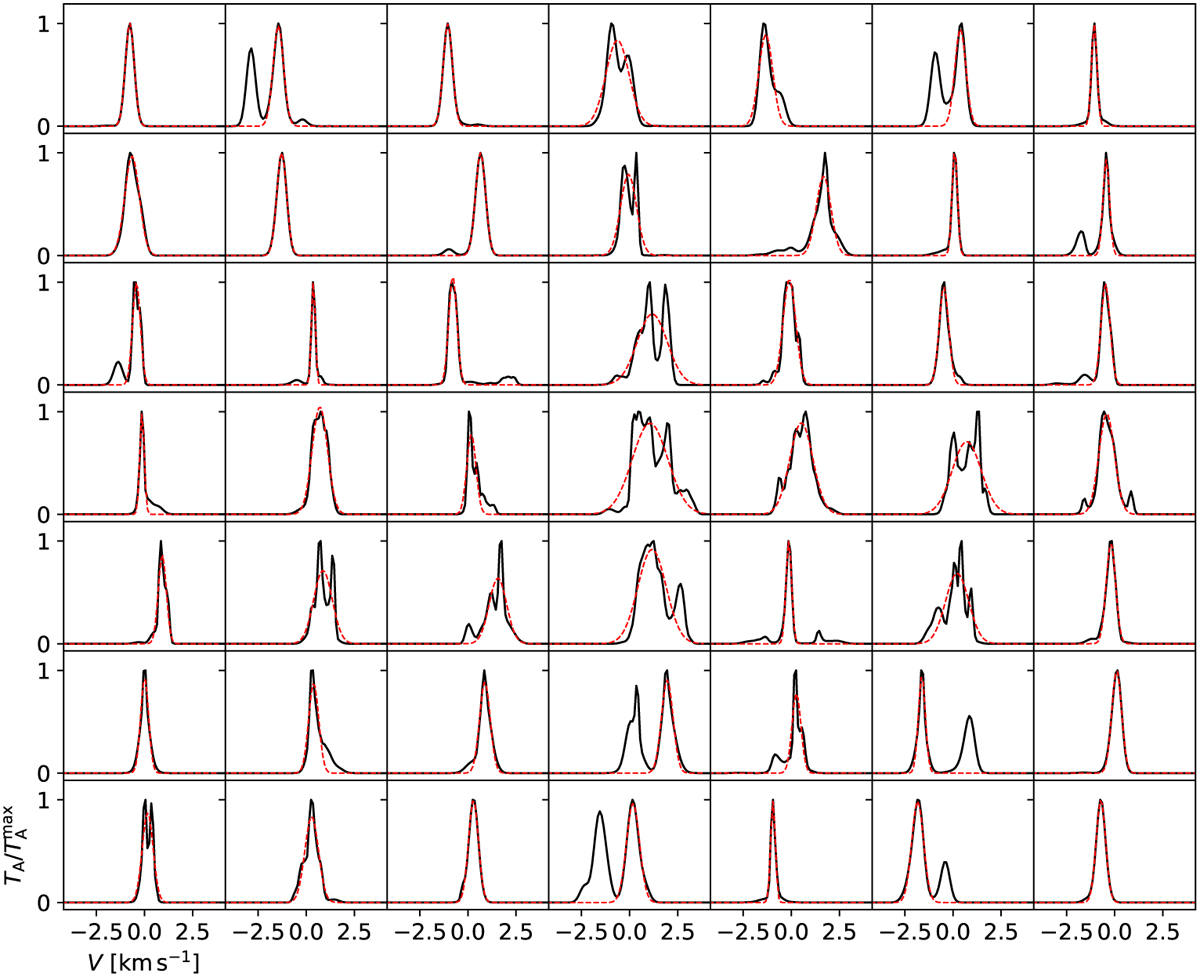
Examples of fits to synthetic spectra from the MHD model (solid black lines) with a single Gaussian component (dashed red lines). The spectra are for C18O (direction x, R = 8) with no added observational noise. The initial values for the intensity and velocity were set based on the peak values in the spectra. The plotted spectra were normalised to a maximum value of one.
Current usage metrics show cumulative count of Article Views (full-text article views including HTML views, PDF and ePub downloads, according to the available data) and Abstracts Views on Vision4Press platform.
Data correspond to usage on the plateform after 2015. The current usage metrics is available 48-96 hours after online publication and is updated daily on week days.
Initial download of the metrics may take a while.