Fig. 19
Download original image
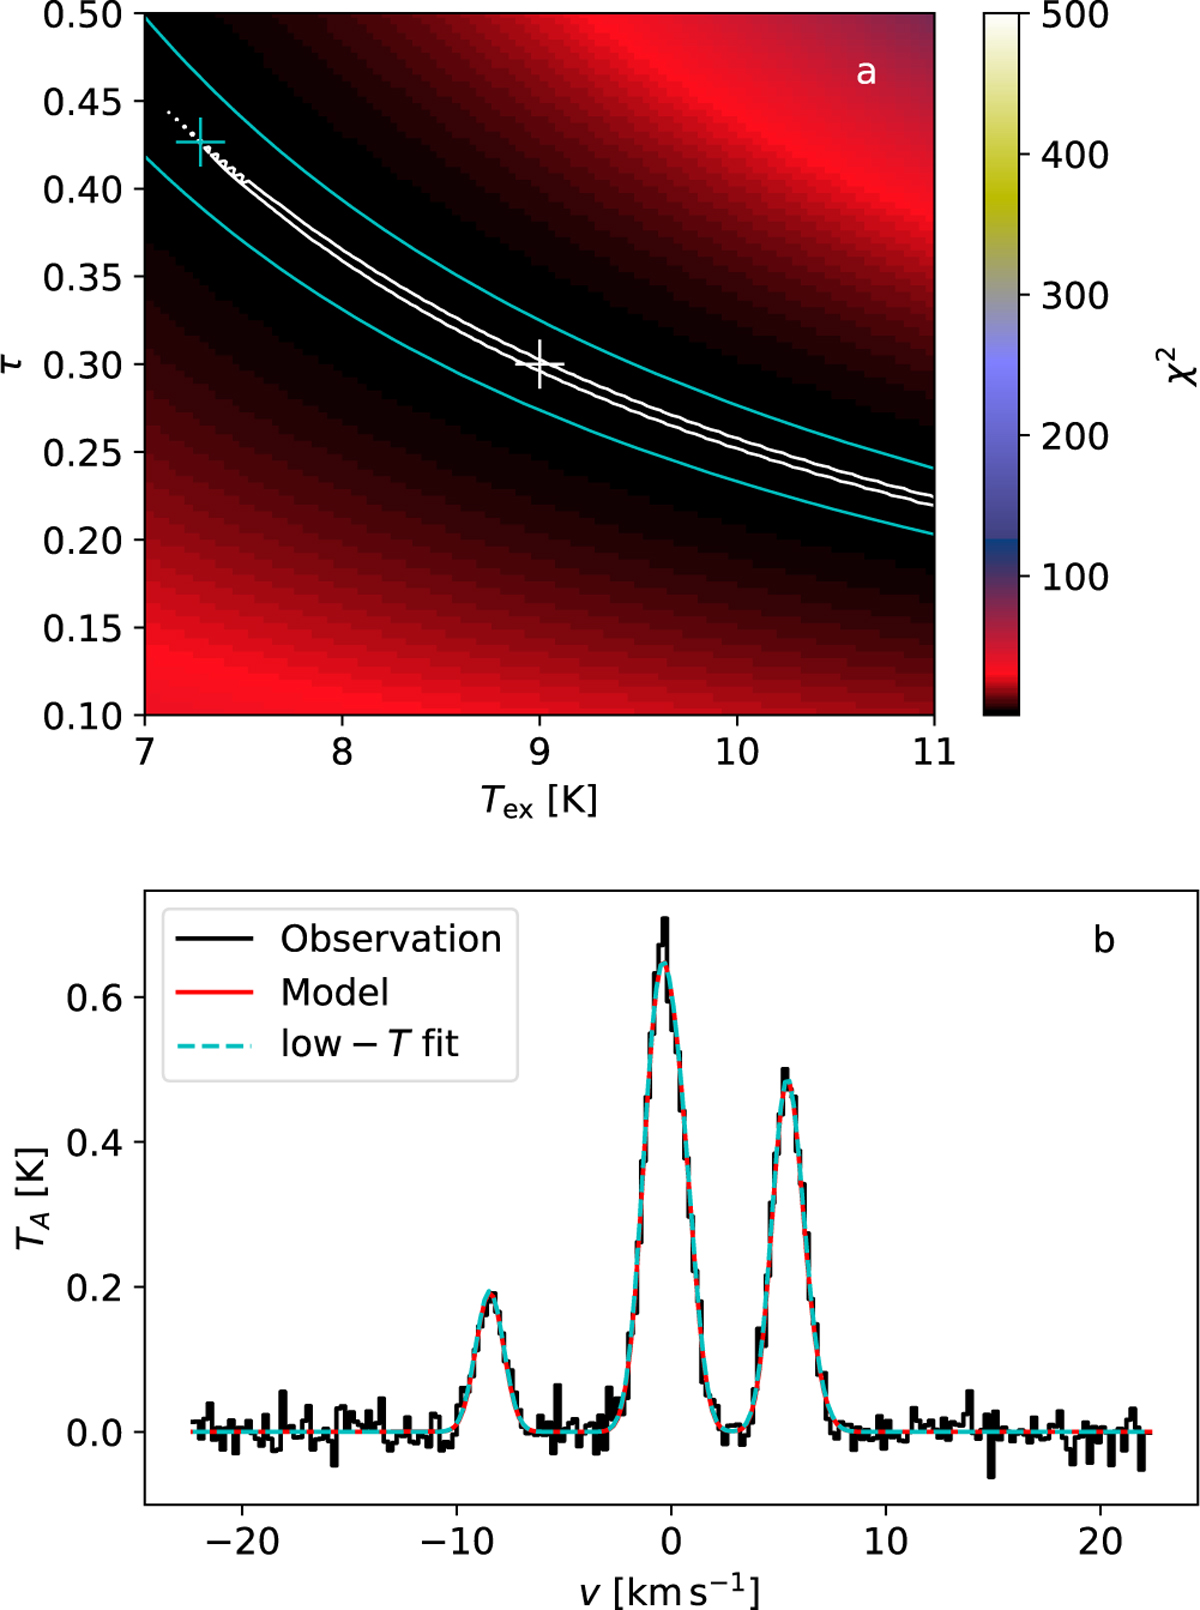
Example of hyperfine fits with degeneracy between the Tex and τ parameters. The upper frame shows χ2 values over a (Tex, τ) plane, with the χ2 minimum at the centre of the image (the white cross). The white and cyan contours correspond to a 1% and 40% increase over the minimum χ2. The bottom frame shows the spectrum (black line), the original model (spectrum without noise; red line), and the spectrum corresponding to the cyan cross in frame a (dashed cyan line).
Current usage metrics show cumulative count of Article Views (full-text article views including HTML views, PDF and ePub downloads, according to the available data) and Abstracts Views on Vision4Press platform.
Data correspond to usage on the plateform after 2015. The current usage metrics is available 48-96 hours after online publication and is updated daily on week days.
Initial download of the metrics may take a while.