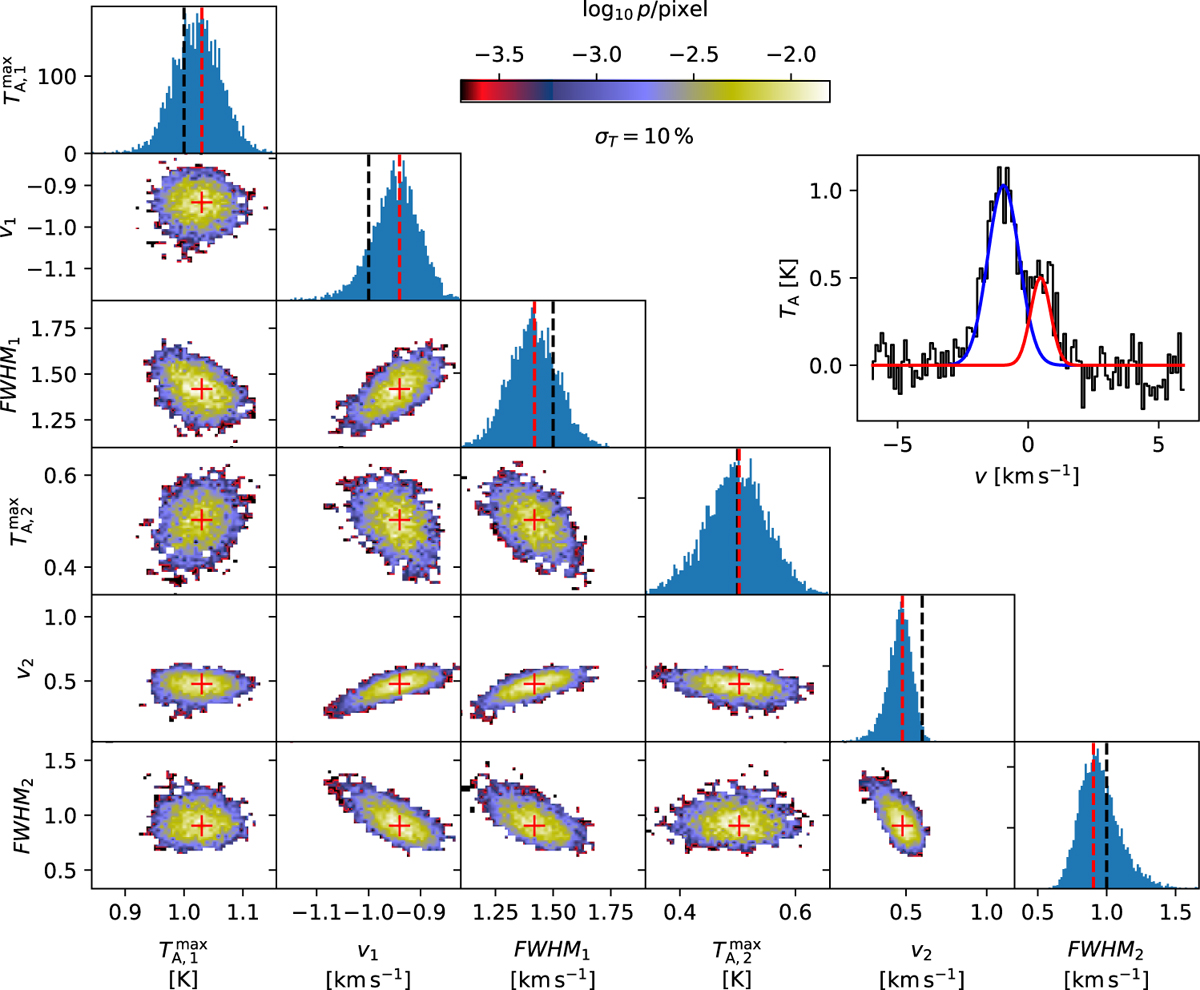
Fig. 17
Download original image
MCMC error estimates for a two-component Gaussian fit. The synthetic spectrum consists of two Gaussian components and white noise with σT = 10% relative to the peak value in the spectrum. The corner plot shows the parameter correlations, where the colours of the 2D histogram correspond to the logarithm of probability (MCMC samples per pixel), as indicated by the colour bar on top. The red crosses correspond to the least-squares solution. The diagonal frames show the histograms for the individual parameters, and the dashed black and red lines correspond to the true values (before observational noise is added) and to the least squares fit, respectively. The frame on the right shows this particular fitted spectrum (black line) and the two components corresponding to the χ2 minimum.
Current usage metrics show cumulative count of Article Views (full-text article views including HTML views, PDF and ePub downloads, according to the available data) and Abstracts Views on Vision4Press platform.
Data correspond to usage on the plateform after 2015. The current usage metrics is available 48-96 hours after online publication and is updated daily on week days.
Initial download of the metrics may take a while.