Fig. 15
Download original image
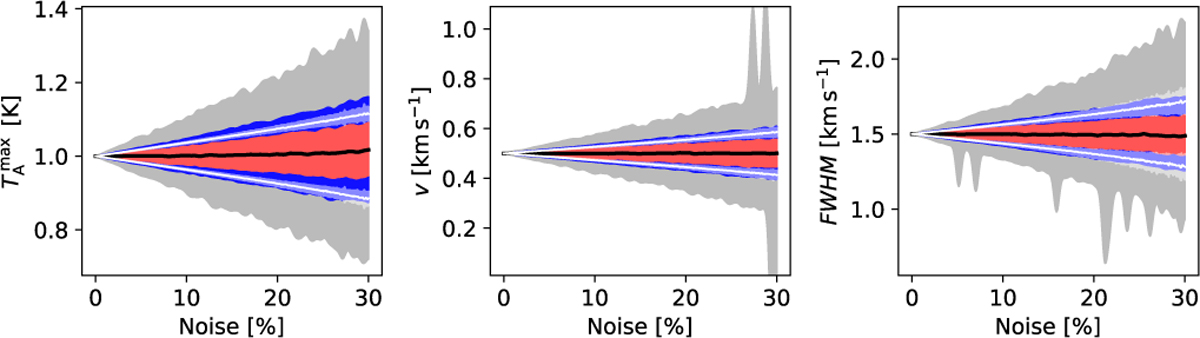
Parameter uncertainties in single-component Gaussian fits to spectra containing one Gaussian. The shaded regions show the error distributions for the estimated parameters as a function of the relative noise 1-30%. The grey, blue, and red colours correspond to [0.01, 99.9], [10, 90], and [25, 75] percentile intervals, respectively. The solid black line shows the median estimates. The solid white lines correspond to the mean 1-σ error estimates (plotted relative to the true values), as obtained from 100 Monte Carlo samples. The white shaded regions correspond to the 1-σ dispersion of the error estimates between spectra at the same noise level.
Current usage metrics show cumulative count of Article Views (full-text article views including HTML views, PDF and ePub downloads, according to the available data) and Abstracts Views on Vision4Press platform.
Data correspond to usage on the plateform after 2015. The current usage metrics is available 48-96 hours after online publication and is updated daily on week days.
Initial download of the metrics may take a while.