Fig. 11
Download original image
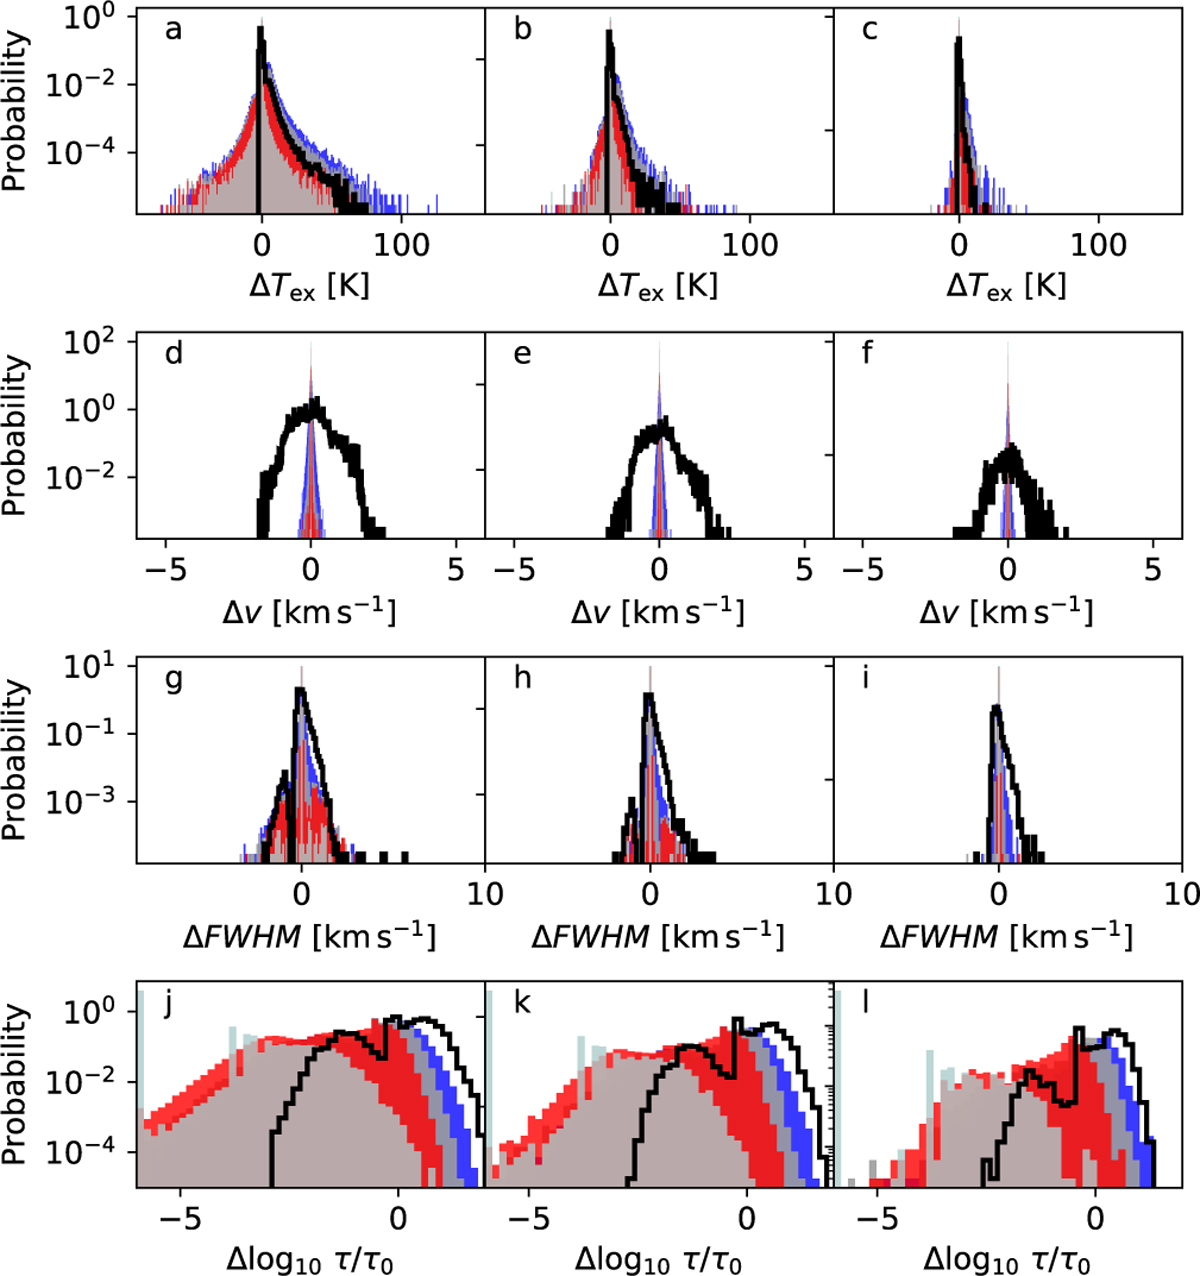
Dispersion of parameter estimates in N2H+ fits of synthetic spectra from the MHD model. From left to right, the frames correspond to synthetic observations in the R = 2, 8, and 32 maps. The filled histograms (in order of increasing width) correspond to noise levels of 1%, 3%, 10%, and 20%. They correspond to the parameter estimates relative to those obtained for spectra without noise (absolute difference on first three rows and logarithm of the ratio in the bottom row). The latter are plotted for reference with solid black lines and shifted to the mean value of zero.
Current usage metrics show cumulative count of Article Views (full-text article views including HTML views, PDF and ePub downloads, according to the available data) and Abstracts Views on Vision4Press platform.
Data correspond to usage on the plateform after 2015. The current usage metrics is available 48-96 hours after online publication and is updated daily on week days.
Initial download of the metrics may take a while.