Fig. 10
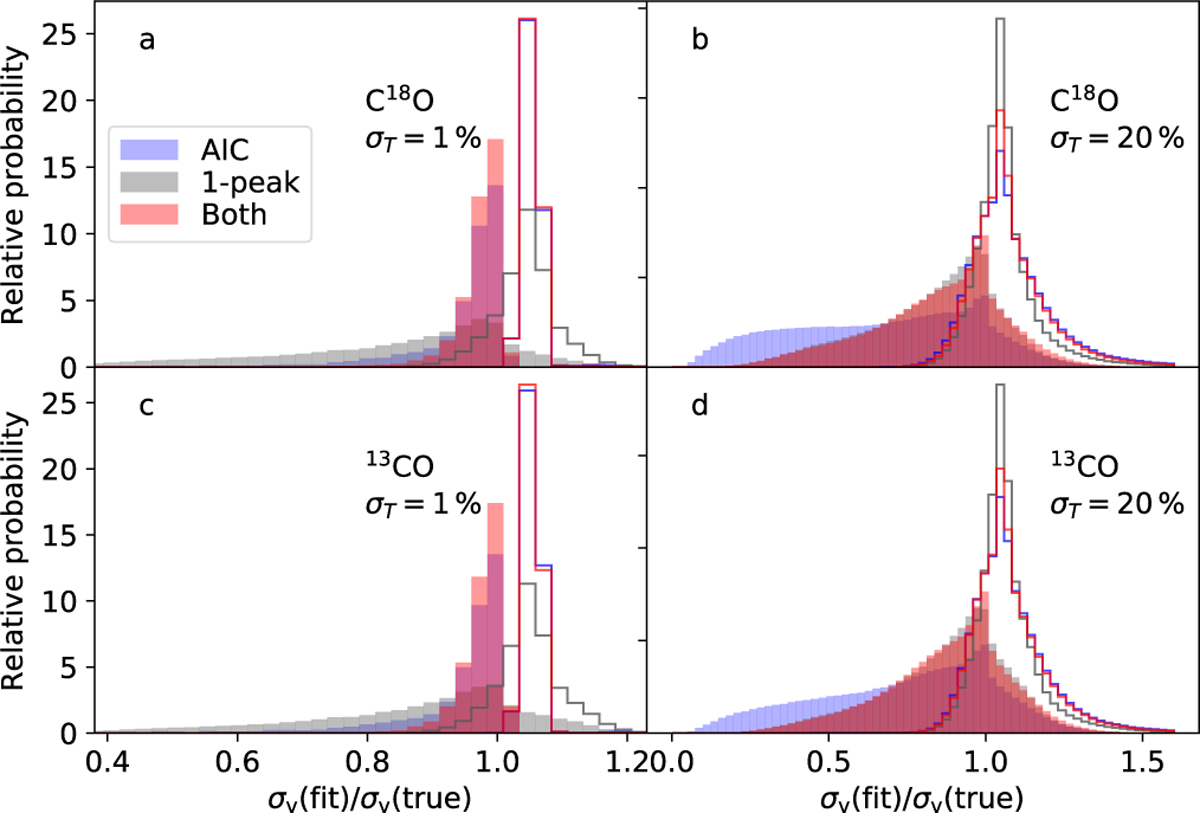
Download original image
Histograms for the ratio of the velocity dispersion recovered by single-component Gaussian fits (σv(fit)) and the true velocity dispersion of the synthetic spectra (σv(true)). Histograms correspond to spectrum subsets where the best model has only a single velocity component (AIC, based on the AIC criterion), spectra have only a single peak (“1-peak”), and the intersection of these two samples (“both”). The true velocity dispersion was calculated either for the whole spectrum (filled histograms) or only within 2.5σv(fit) around the fitted centre velocity (unfilled histograms). Results are shown for C18O and 13CO (upper and lower frames, respectively) and for noise levels of σT = 1% and σT = 10% (left and right frames, respectively).
Current usage metrics show cumulative count of Article Views (full-text article views including HTML views, PDF and ePub downloads, according to the available data) and Abstracts Views on Vision4Press platform.
Data correspond to usage on the plateform after 2015. The current usage metrics is available 48-96 hours after online publication and is updated daily on week days.
Initial download of the metrics may take a while.