Fig. 1
Download original image
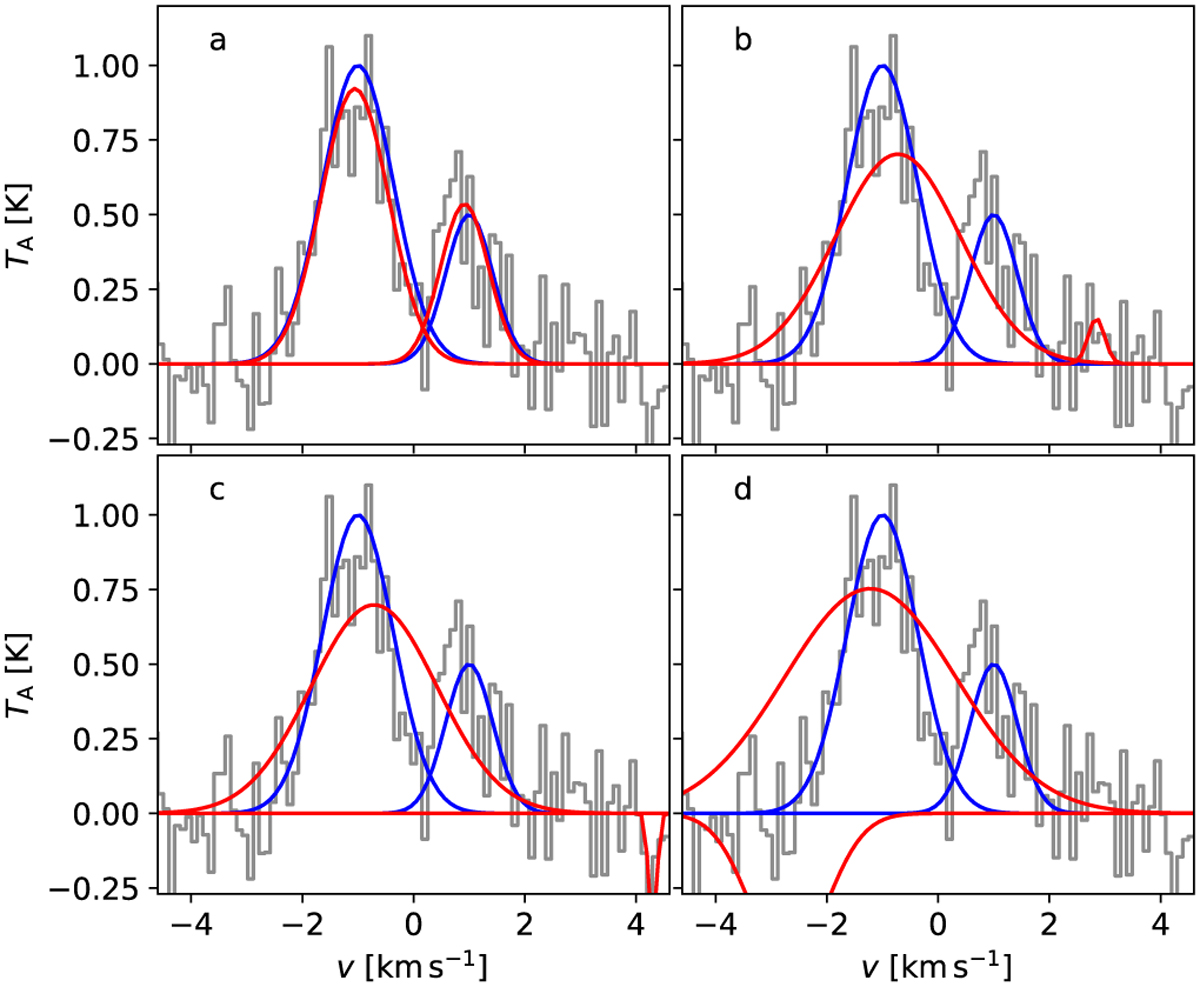
Effect of initial values of the model parameters. The frames show a synthetic spectrum (black histogram) that correspond to two Gaussian peaks (solid blue lines) and white noise. The frames show four potential outcomes, where χ2 minimisation with different initial values has led to different outcomes. The solid red lines show the fitted two components. The fits correspond to local χ2 minima, when no other constraints are used.
Current usage metrics show cumulative count of Article Views (full-text article views including HTML views, PDF and ePub downloads, according to the available data) and Abstracts Views on Vision4Press platform.
Data correspond to usage on the plateform after 2015. The current usage metrics is available 48-96 hours after online publication and is updated daily on week days.
Initial download of the metrics may take a while.