Fig. 2
Download original image
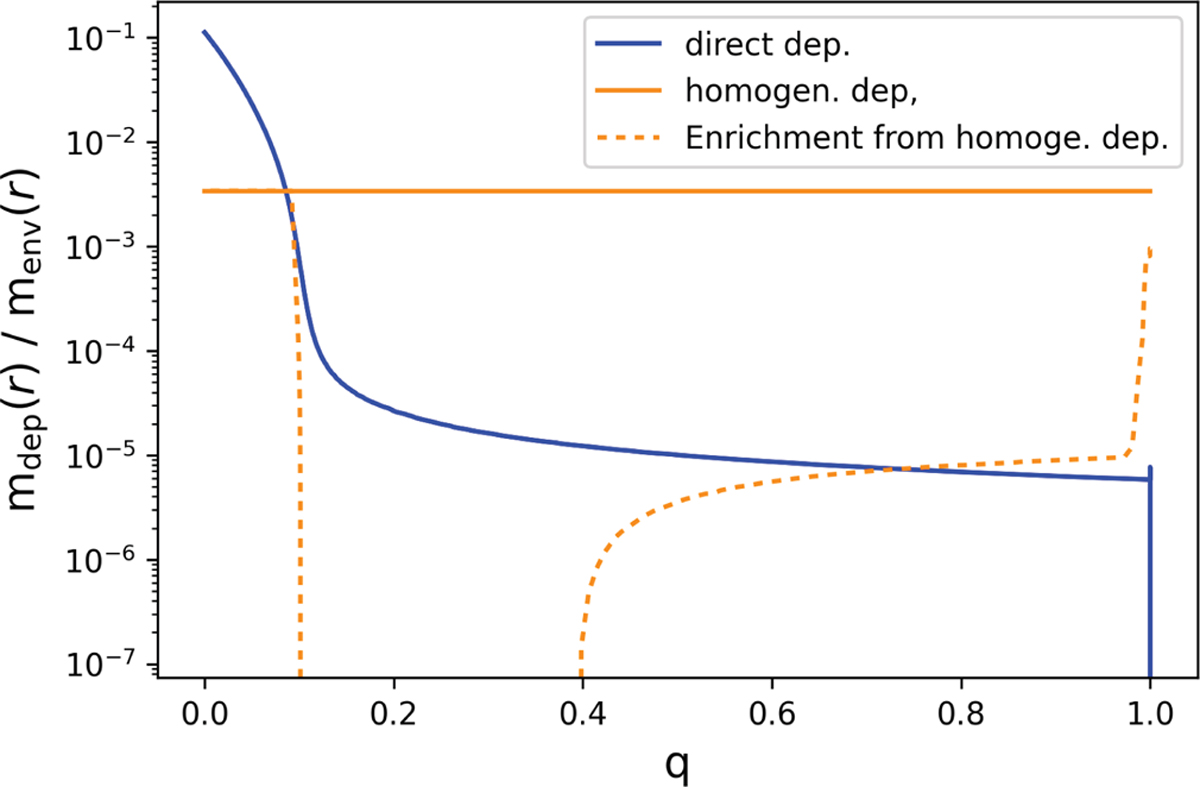
Difference between the two deposit models: direct deposit (blue) and homogeneous deposit (orange). The x-axis gives the normalized mass coordinate of the envelope q. This figure specifically shows the deposit models for Oligarchic growth at 47 kyr when the envelope mass is 1.5 × 10⁻⁵ M⊕. There is no fragmentation yet. The ablation enriches the envelope metallicity up to 10% in the most inner region. The homogeneous deposit has the same total deposited mass, but smoothed. However, the actual enrichment is not homogeneous, as shown by the orange dashed line, due to some layers already being saturated. For different formation conditions and at different times the difference between the deposition and the actual enrichment changes.
Current usage metrics show cumulative count of Article Views (full-text article views including HTML views, PDF and ePub downloads, according to the available data) and Abstracts Views on Vision4Press platform.
Data correspond to usage on the plateform after 2015. The current usage metrics is available 48-96 hours after online publication and is updated daily on week days.
Initial download of the metrics may take a while.