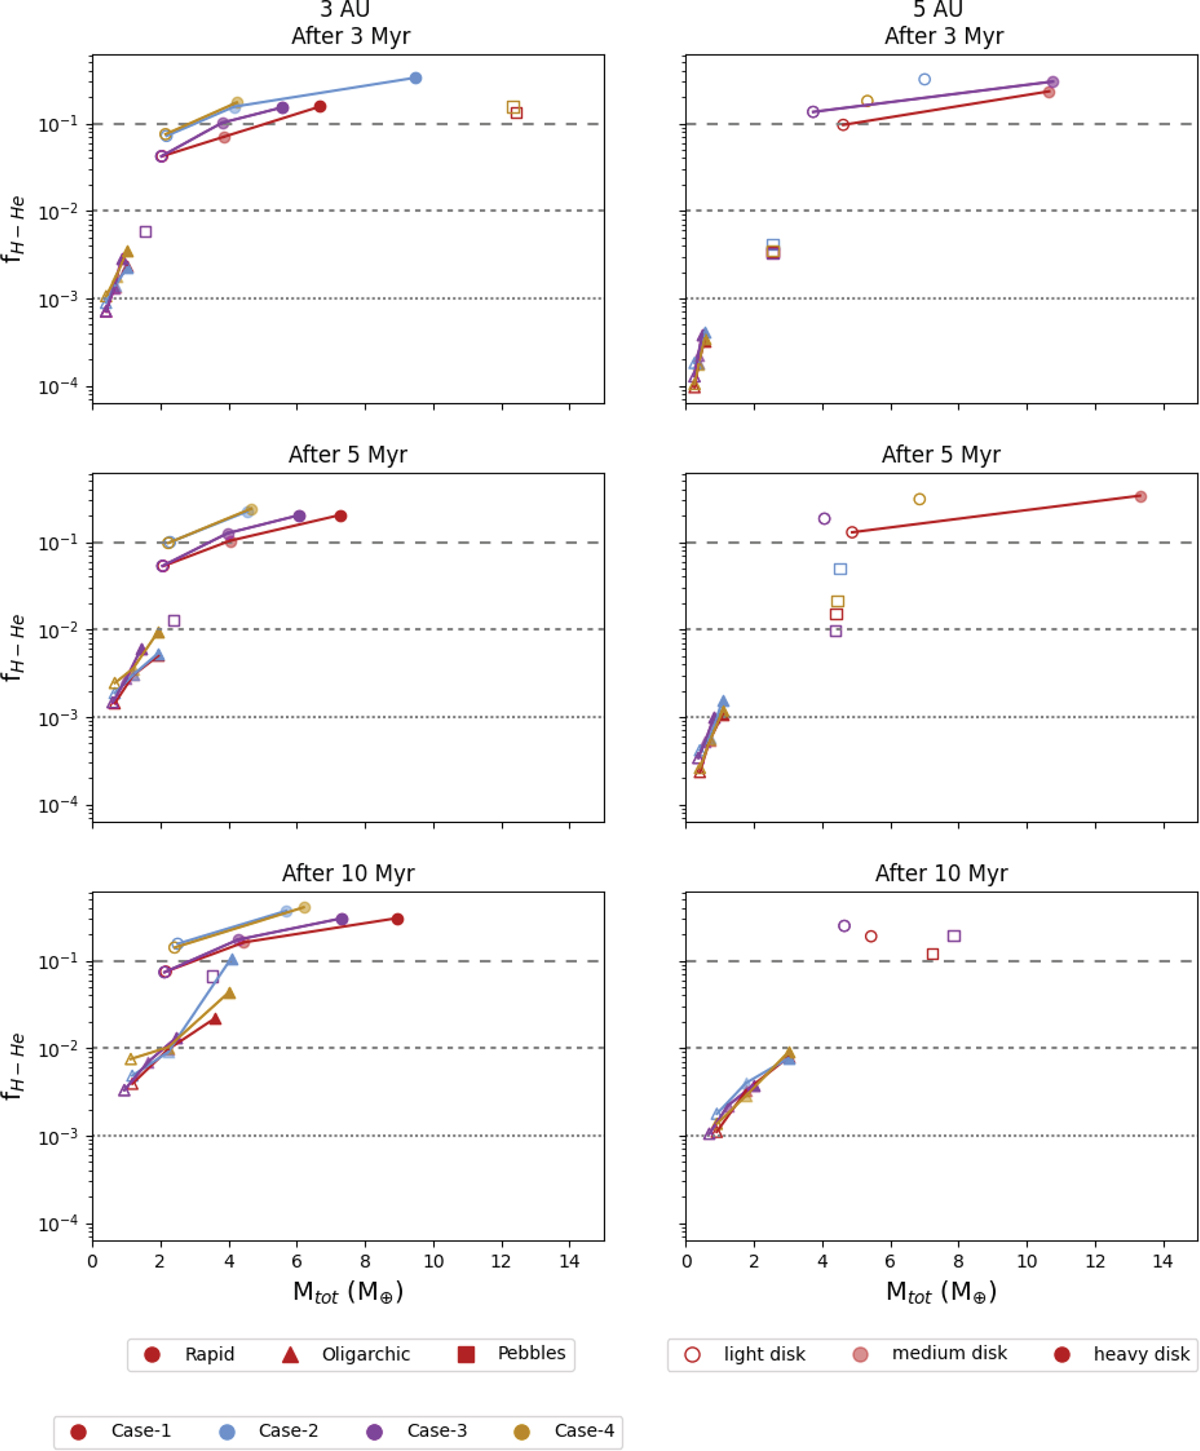
Fig. 10
Download original image
H-He mass fraction after 3 Myr (upper panels), 5 Myr (middle panels), and 10 Myr (lower panels). The left panels show in situ formation at 3 au and the right panels at 5 au. The colors indicate the heavy-element interaction models. Case-1, Case-2, Case-3, and Case-4 are given in red, blue, purple, and yellow, respectively. The three different solid accretion rates are distinguished by different symbols. We also show the light initial disk results by a transparent marker, the medium disk result with a 0.5 opacity marker, and the heavy disk result with a full opacity marker. The light, medium and heavy results of the same model are connected by a line, as we would expect that in intermediate disk would produce a final H-He fraction approximately along this line. The total masses in the figure are limited to below 15 M⊕, focusing on the distribution for mini-Neptune type planets. Planets that reached the crossover mass (Menv = Mcore) are not shown, even if their total mass is below 15 M⊕.
Current usage metrics show cumulative count of Article Views (full-text article views including HTML views, PDF and ePub downloads, according to the available data) and Abstracts Views on Vision4Press platform.
Data correspond to usage on the plateform after 2015. The current usage metrics is available 48-96 hours after online publication and is updated daily on week days.
Initial download of the metrics may take a while.