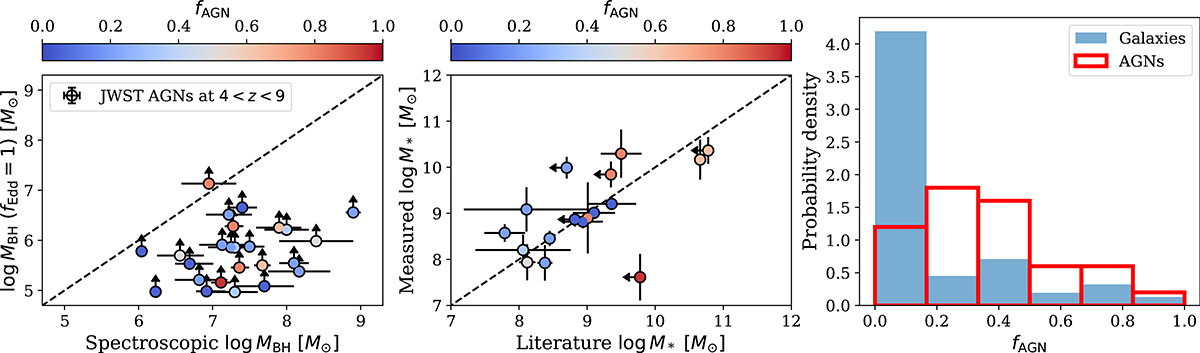
Fig. A.1.
Download original image
Distribution of black hole masses (MBH), stellar masses (M*), and the fraction of AGN emission (fAGN) of known sources (see text). The left panel compares the lower limit MBH assuming an Eddington ratio of fEdd = 1 that we calculated and actual values reported in the literature. The data points are color-coded according to the inferred fAGN of each source. The middle panel shows the M* from other studies versus our own measurements. The right panel illustrates the distribution of fAGN for active and inactive galaxies. To compensate for the difference in sample sizes, we normalize the bin heights of the histogram, ensuring that the integral of the distribution equals unity.
Current usage metrics show cumulative count of Article Views (full-text article views including HTML views, PDF and ePub downloads, according to the available data) and Abstracts Views on Vision4Press platform.
Data correspond to usage on the plateform after 2015. The current usage metrics is available 48-96 hours after online publication and is updated daily on week days.
Initial download of the metrics may take a while.