Fig. 8.
Download original image
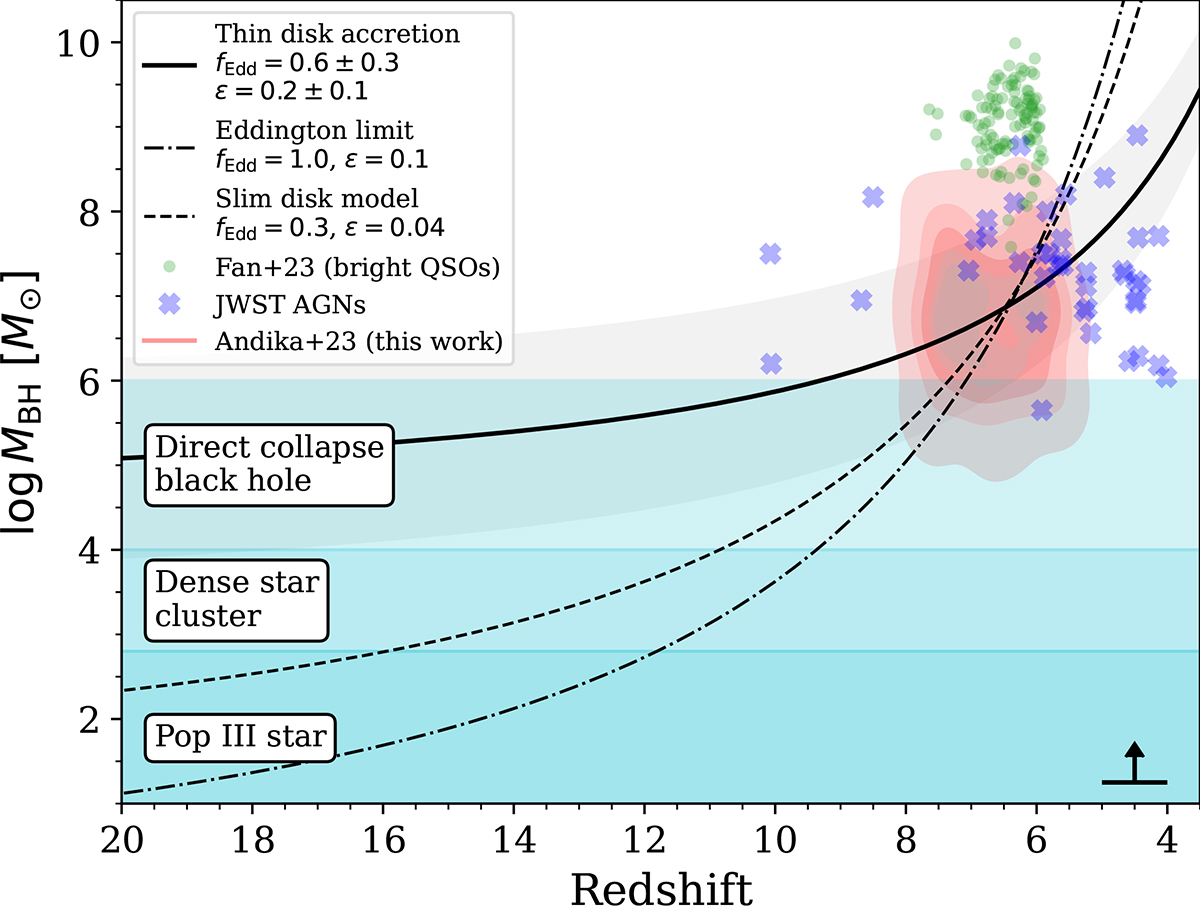
Black hole mass growth as a function of redshift. The red contour represents the expected lower limit masses of the quasar candidates identified in this study. Additionally, the typical photometric redshift uncertainty for these candidates is illustrated in the lower right corner of the panel. Green circles depict the bright quasar samples from Fan et al. (2023) while blue crosses display broad-line AGNs from the literature that have been observed with JWST spectroscopy (see main text). The cyan-shaded region shows the mass range of different progenitors. The solid black line and region show an evolutionary track along with its posterior distribution, assuming a thin disk accretion and heavy seed progenitors. On the other hand, cases where we use a thin disk accretion at the Eddington limit and a slim disk model to grow light seeds into SMBHs are shown with dash-dotted and dashed black lines.
Current usage metrics show cumulative count of Article Views (full-text article views including HTML views, PDF and ePub downloads, according to the available data) and Abstracts Views on Vision4Press platform.
Data correspond to usage on the plateform after 2015. The current usage metrics is available 48-96 hours after online publication and is updated daily on week days.
Initial download of the metrics may take a while.